background image

37

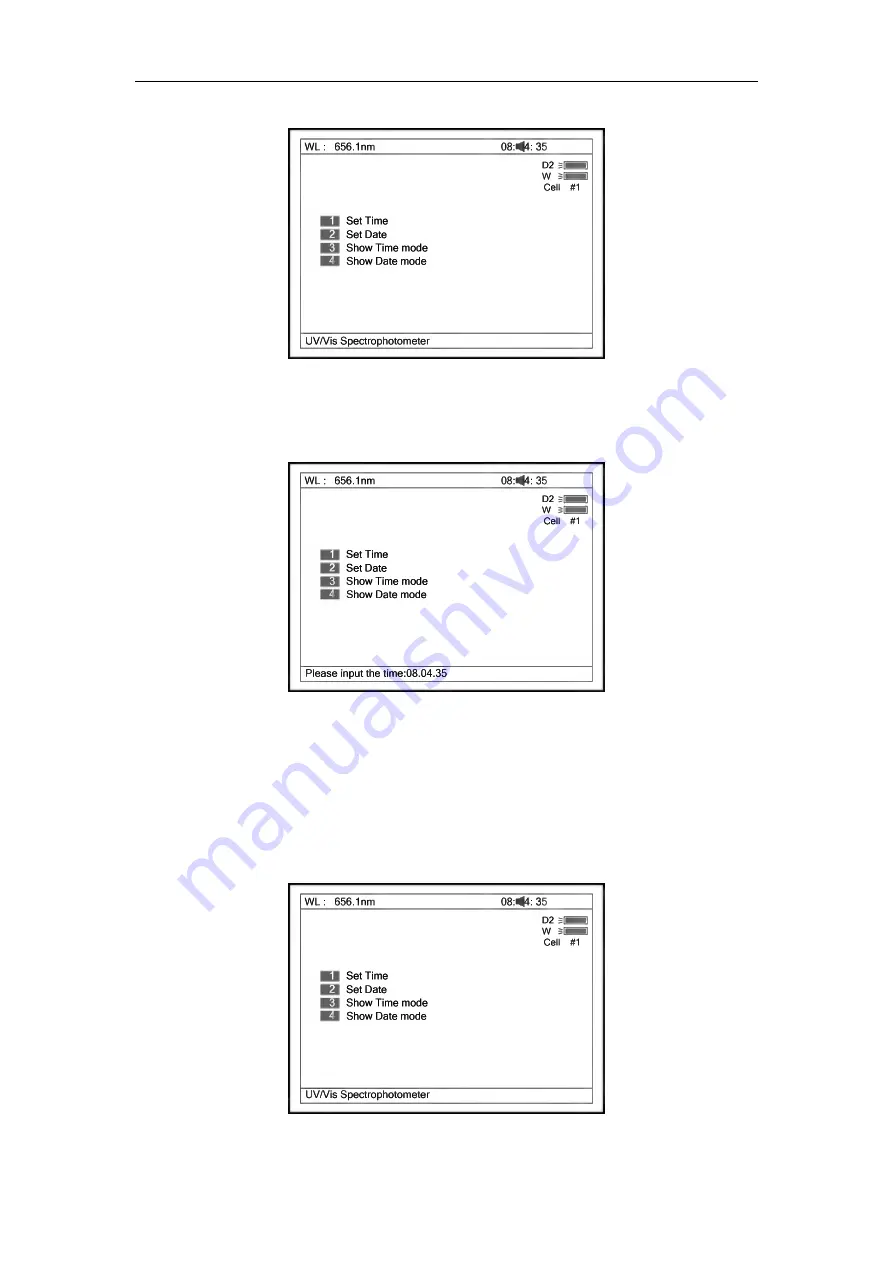
Fig 85

1. Press

1

in Fig 85

to modify time by pressing the numeric keypad (Fig

86).

Fig 86

2. Press

2

in Fig 85

to modify date by pressing the numeric keypad.

3. Press

3

in Fig 85

to set the date display on the top right corner of the

screen.

4. Press

4

in Fig 85

to set the time display on the top right corner of the

screen (Fig 87).

Fig 87

Summary of Contents for DU-8800DS Series

Page 1: ...USER S MANUAL For DU 8800DS RS Series Spectrophotometers Drawell Scientific...

Page 2: ......

Page 3: ...Operation 5 Prepare the Spectrophotometer 5 Description of keys 5 Turn on spectrophotometer 6 Basic operation 7 Analyse Sample 12 Basic Mode 12 Quantitative 15 WL Scan 20 Kinetics 25 DNA Protein 28 Mu...

Page 4: ......

Page 5: ...f the chemicals used in spectrophotometry are corrosive and or inflammable and samples may be radioactive toxic or potentially infective Care should be taken to follow the normal laboratory procedures...

Page 6: ...ly shielded cables supplied by us are used when connecting the instrument to computers and accessories Introduction This instrument Fig 1 is a double beam general purpose instrument designed to meet t...

Page 7: ...photometer Fig 2 In your spectrophotometer light from the lamp is focused on the entrance slit of the monochromator where the collimating mirror directs the beam onto the grating The grating disperses...

Page 8: ...tness 0 001A Stray Light 0 05 220nm 360nm Photometric Range 0 200 T 0 3 3 0A Noise 0 001A 500nm Drift 0 002A h 500nm Power Requirements AC90 250V 50 60Hz Dimensions mm 640L 530D 270H Light Source Tung...

Page 9: ...rate System with the Search 656 1nm to set the wavelength to the deuterium lamp emission line NOTE This symbol means Caution Risk of Danger Operation Prepare the spectrophotometer Fig 3 is the control...

Page 10: ...position Only available when Auto Changer used HELP Reserved key for future Function Extending not available now Turn on spectrophotometer Turn on spectrophotometer by pressing the Power Switch IO see...

Page 11: ...tored in the memory of the instrument Usually user may not rebuild system baseline before test Only putting the sample into the sample light path and the reference into the Reference Light Path the re...

Page 12: ...n is too thick Energy Low will appear following the Blanking on the screen Fig 8 If Energy too Low appears following the Blanking the test will be paused and Warning will appear on the screen Fig 9 2...

Page 13: ...ence cuvette with reference solution into the Reference Light Path and the sample cuvette with reference solution into the Sample Light Path Press ZERO to obtain the user baseline Then take out the sa...

Page 14: ...ess or to browse the files stroed in memory Then if 1 The key ENTER be pressed the file selected will be loaded and displays on the screen Fig 14 Note 1 The file selected must match WL scan test s typ...

Page 15: ...croll characters and pressing to alter capital letter to miniscule Table 2 shows all characters built in 2 If the name already exists in memory the warning duplicated name are you sure will appear Yes...

Page 16: ...ze Sample For different user s requirements we provide different test methods Basic Mode Push the blank cuvette into the Reference Light Path and Main Light Path In main menu Fig7 press 1 to enter Bas...

Page 17: ...select Abs mode Press ZERO for Blanking and then Push the sample into Main Light Path to take reading Fig 20 2 T mode The operation is the same as Abs test mode but pressing F2 to select T mode 3 Con...

Page 18: ...Path to take reading of concentration 4 2 Push sample of known concentration into the Main Light Path Press F4 to input known Conc value Fig 24 Then push the sample into Main Light Path to take readi...

Page 19: ...t Note If no automatic changer installed cell 1 will disappear in Fig26 Fig 26 How to operate 1 Press F1 to select unit of concentration Fig 27 Fig 27 2 Press SET to select correction methods and ente...

Page 20: ...ic fit 3 2Press F2 in Fig 29 to enter directly a known standard curve Fig29A Fig 29A The constants to be entered depend on which fitting method selected The table below lists their relation Fitting Me...

Page 21: ...modify the inputted data Fig31 Press ESC STOP to finish inputting and to exit Fig 32 Fig 30 Fig 31 3 3 2 Push the blank cuvette into the Reference Light Path and Main Light Path press 0Abs 100T the i...

Page 22: ...For linear fits r represent fitting coefficient of linear regression r 1 is best fitting usually r is very close to 1 Note If there are few standard samples it is not suitable for selecting square fit...

Page 23: ...h type fit At last press ENTER TO comfirm b Known standard curve which is not saved in the instrument See 3 2 For Fig 29 enter a known standard curve directly c Use the standard samples for the test F...

Page 24: ...Press SAVE to save the results and fitting parameters Print Test Report Press the key PRINT to print the test report Fig 39 Fig 40 WL Scan Press 3 in main menu for WL Scan test Fig 41 ESC STOP to exi...

Page 25: ...essing or Fig 42 Note Scan step allows the selection of 0 1nm 0 2nm 0 5nm 1nm 2nm and 5nm Scan speed allows the selection of HI MEDIUM and LOW For survey scan we suggest 5nm HI For detailed scan we su...

Page 26: ...canning When scan has finished the beeper beeps 3 times Fig 46 Fig 45 Fig 46 5 If you want to change the scale press or to change x scale Fig 47 input upper limit and lower limit by pressing the numer...

Page 27: ...earch Fig 49 Fig 49 1 Peak to peak press F1 to set peak height and input value by pressing the numeric keypad Fig 50 Press to search the peak from left to right and press to search from right to left...

Page 28: ...step The value of every point searched will be displayed on the screen Save Curve Press SAVE to save the curve Note Load Save requires the first scan display page Fig 48 Press ESC if in Search to ret...

Page 29: ...y pressing the numeric keypad Fig 54 Fig 54 2 Select the test mode Abs or T by pressing F2 Fig 55 Fig 55 3 Set wavelength by pressing SET Pull the blank cuvette into the Reference Light Path and Main...

Page 30: ...line between the Begin Time and End Time will be calculated The gradient of this line gives the rate of change of A min Note I U Factor A min Fig 57 Fig 58 6 If you want to change the scale please re...

Page 31: ...E to save curve Note Load Save requires the first kinetics display page Fig 56 Press ESC if in Search to return to the required page Print Test Report Press the key PRINT to print the curve you have l...

Page 32: ...nt algorithm you can enter your own values for f1 f4 Press F1 to set f1 f4 Input the value by pressing the numeric keypad Fig 61 Fig 61 2 Press F2 to select test mode Absorbance difference 1 is for te...

Page 33: ...g 5 Pull the sample cuvette into Main Light Path press START to test the sample The test result will be displayed on the screen Fig 65 Fig 65 6 If there is more than one sample repeat step 5 for the n...

Page 34: ...ta Press the key SAVE to save data Print Test Report Press the key PRINT to print the test result Fig 67 Fig 67 Multi Wavelength Press 6 in main menu for Multi WL Fig 68 ESC STOP to exit Fig 68 To loa...

Page 35: ...OP to finish setup and exit Note It is recommended to enter the highest wavelength first Fig 69 2 Press F2 to select mode Fig 70 Fig70 3 Push the blank cuvette into the Reference Light Path and Main L...

Page 36: ...t has finished the wavelength will go to the first WL 6 Press or for searching Input the sample number the result will be displayed on the screen Press or to browse the test results one by one Save Da...

Page 37: ...tting and Calibration Utility Press 7 in Main menu for Utility Fig 73 ESC STOP to exit Fig 73 WL Reset Press 1 to reset wavelength Fig74 Fig 74 Printer Press 2 to set printer Fig 75 ESC STOP to exit F...

Page 38: ...ig 75 to select printer HP PCL 1 colour cartridge PCL black mode Epson ESC P or Epson P2 or above Fig77 Fig 77 4 Press 4 in Fig 75 to select print mode If you select Print screen mode a little icon wi...

Page 39: ...s 1 in Fig 79 to switch on off D2 Fig 80 Fig 80 2 Press 2 in Fig 79 to reset usage time of D2 Fig 81 Press or to select Yes or No and then press ENTER Fig 81 3 Press 3 in Fig 79 to switch on off W The...

Page 40: ...age of W Fig 83 Press or to select Yes or No and then press ENTER Fig 83 5 Press 5 in Fig 79 to set the switch usage point of D2 and W lamp Fig 84 84 Clock Press 4 In Fig73 to set the display mode and...

Page 41: ...c keypad Fig 86 Fig 86 2 Press 2 in Fig 85 to modify date by pressing the numeric keypad 3 Press 3 in Fig 85 to set the date display on the top right corner of the screen 4 Press 4 in Fig 85 to set th...

Page 42: ...ESC STOP to exit Fig 89 1 Press SET to set the wavelength Press ENTER to edit and input wavelength by pressing the numeric keypad Fig 90 ESC STOP to finish inputting and exit Fig 90 2 Press F1 to set...

Page 43: ...sample calibrated neutral density filter into Main Light Path Press START to check The results will be displayed on the screen Fig 94 If the discrepancy between the results and the calibrated standar...

Page 44: ...validity Fig 95 ESC STOP to exit Fig 95 2 Press F1 to set the standard peak Press ENTER to edit and input wavelength by pressing the numeric keypad Fig96 ESC STOP to finish inputting and exit Fig 96 3...

Page 45: ...liquid into Main Light Path Press START to check The results will be displayed on the screen Fig 99 If the discrepancy between the results and the calibrated values is not more than the tolerance pas...

Page 46: ...plays as Fig 100A Press ESC STOP to exit Fig 100 Fig 100A Beeper on off Press 9 in Fig 73 to turn on off the beeper Delete entire saved files Press F1 in Fig 73 to delete entire saved files After the...

Page 47: ...cover Please wipe off the dirt on the cover timely 3 Clean the cuvettes After every test or after a solution change the cuvettes should be cleaned carefully or the remains on the surface would cause...

Page 48: ...pare Fuse and replace it to the working position Step 5 Reset the Fuse Seat Replace the Fuse Seat in the power socket Step 6 Switch on the power Plug the socket and switch on the power 2 Replace lamps...

Page 49: ...crews on the D2 Flange Indicated in the Red Circles in Fig 105 unplug the power connector Indicated in the Red Square in Fig 104 in the Power Board and remove the D2 lamp Draw on the Cotton Glove and...

Page 50: ...me direction as the old one faces Fig 106 Fig 106 Switch on the power observe the Entrance Facula and it should focus on the center of the Slit Fig 107 If the Facula deviate to Left or Right then loos...

Page 51: ...47 Fig 107 Step 8 Finish Reset the cover of the Lamps chamber and fix the screws Reset the cover of the instrument and fix the screws then the course finished...

Page 52: ...l DNA concentration A1 Aref f1 A2 Aref f2 Protein concentration A2 Aref f3 A1 Aref f4 f1 62 9 f2 36 0 f3 1552 f4 757 3 DNA g ml Protein g ml Absorbance difference 260 230 A1 A260nm A2 A230nm Aref A320...

Page 53: ...oabsorbance When a known interfering component with a known spectrum is present the error introduced by this component at the analytical wavelength for the target analyte can be eliminated by selectin...

Page 54: ...en estimated using linear interpolation see Figure A2 This method represents an improvement over the single wavelength reference technique because it corrects for any background absorbance that exhibi...

Page 55: ...Technology Limited Shanghai Drawell Scientific Instrument Co Ltd Add Suite 1506 Lane581 XiuChuan Rd PuDong New Area Shanghai China Tel 0086 21 54411195 Fax 0086 21 33823261 Web www drawell com cn Emai...

Page 56: ...52...

Reviews: