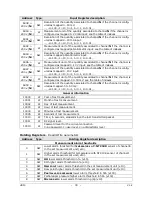
HD50
- 18 -
V1.4
5.2
MONITOR
MENU
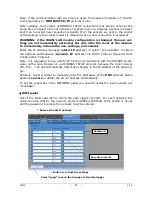
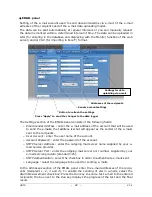
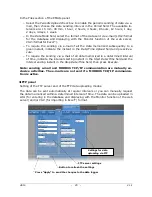
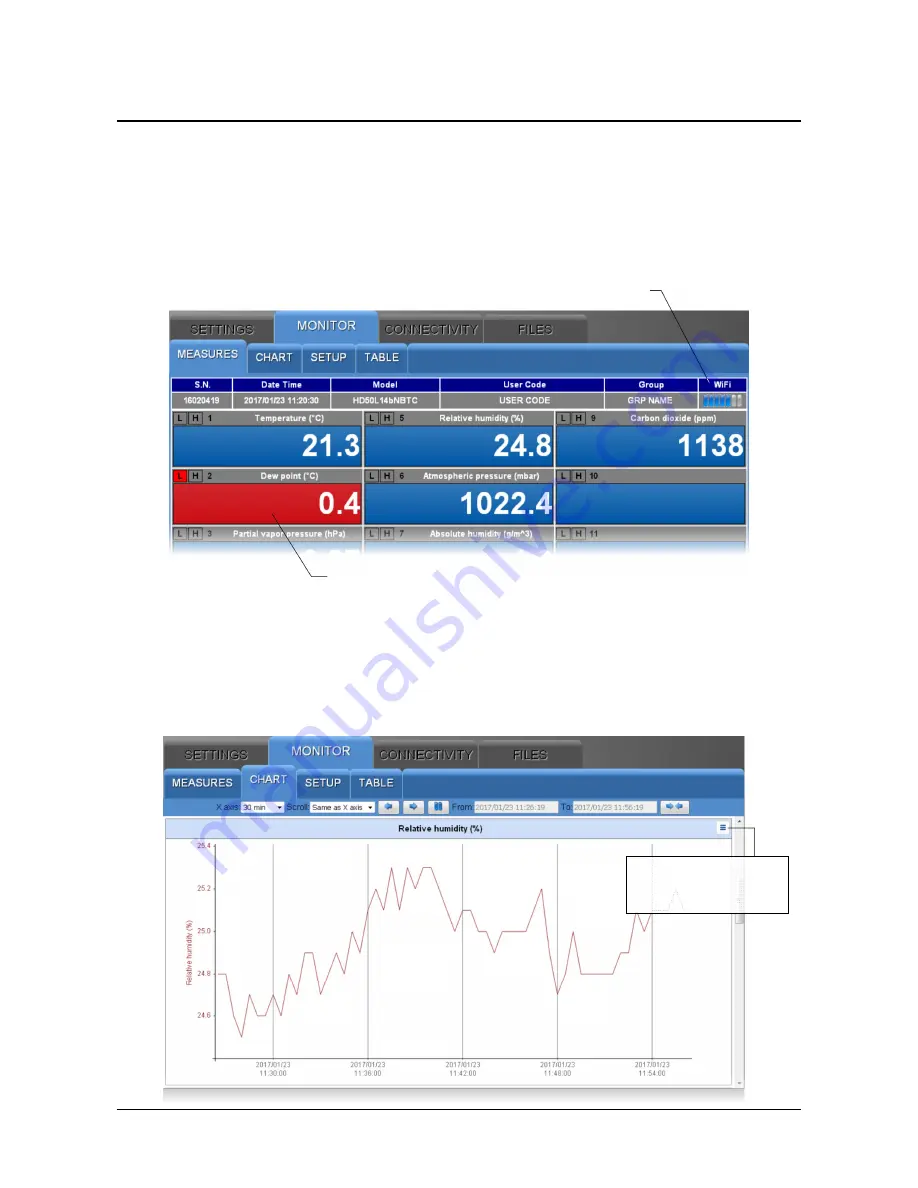
The MONITOR menu allows viewing the real time measurements, both in graphic and
table form. The measurements and the corresponding date/time are updated at inter-
vals equal to the logging interval. The measurements acquired by the Monitor function
can be saved in a log file and exported in CSV format.
•
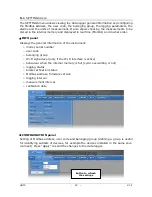
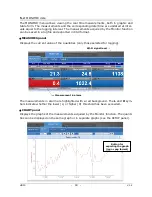
MEASURES panel
Displays the current value of the quantities (only those selected for logging).
The measurements in alarm are highlighted with a red background. The
L
and
H
sym-
bols indicate whether the lower (L) or higher (H) threshold has been exceeded.
•
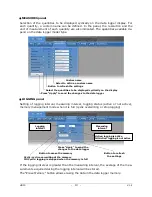
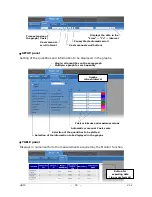
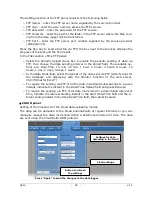
CHART panel
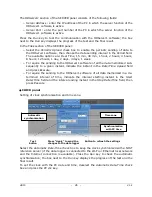
Displays the graphs of the measurements acquired by the Monitor function. The quanti-
ties can be displayed on the same graph or in separate graphs (see the SETUP panel).
Wi-Fi signal level
Measurement in alarm
Button for
exporting the graph
(
jpg
or
png
format)
Summary of Contents for HD50 14b7P TC
Page 52: ...HD50 52 V1 4 NOTES ...
Page 53: ...HD50 53 V1 4 NOTE ...
Page 54: ...HD50 54 V1 4 NOTE ...
Page 55: ......

