OG_MU2-ESP_v10e
27
Circuit Design, Inc.
OPERATION GUIDE
[11] Sampling number control
The number of samples can be adjusted up or down in steps of 10, from 10 to 5000.
To enter a value from the keyboard, double click the field and enter a value. The colour changes when a value is
entered. Press the Enter key and check the value.
[12] Measurement channel control
Selects a channel to measure.
[13] Progress bar
Displays the progress of data acquisition for the measured channel.
[14] Sampling point axis (horizontal axis)
[15] Graph area lines
[16] Graph point
[17] Analyse line
Clicking the graph displays the RSSI absolute level at the top of the graph and as a cursor pop up.
[18] Center line
A line that expresses the center of the graph. This can be hidden with the F7 function key.
■
2.4.3 Air monitor mouse functions
1. Analyse function
When measurement is stopped, you can click on the graph of each channel, and display the RSSI absolute level
and frequency of each channel.
2. Graph scrolling function
When measurement is stopped, you can scroll the graph left and right by pressing the left mouse button.
3. Graph zooming function
When measurement is stopped, you can zoom in on the graph by pressing the Shift key and left mouse button.
Dragging from upper left to lower right defines an area to zoom in.
Dragging from upper right to lower left defines an area to undo zoom (you can also use the pop-up menu or function
keys).
* When starting to scroll or zoom, start with the cursor at a point outside the measurement data.
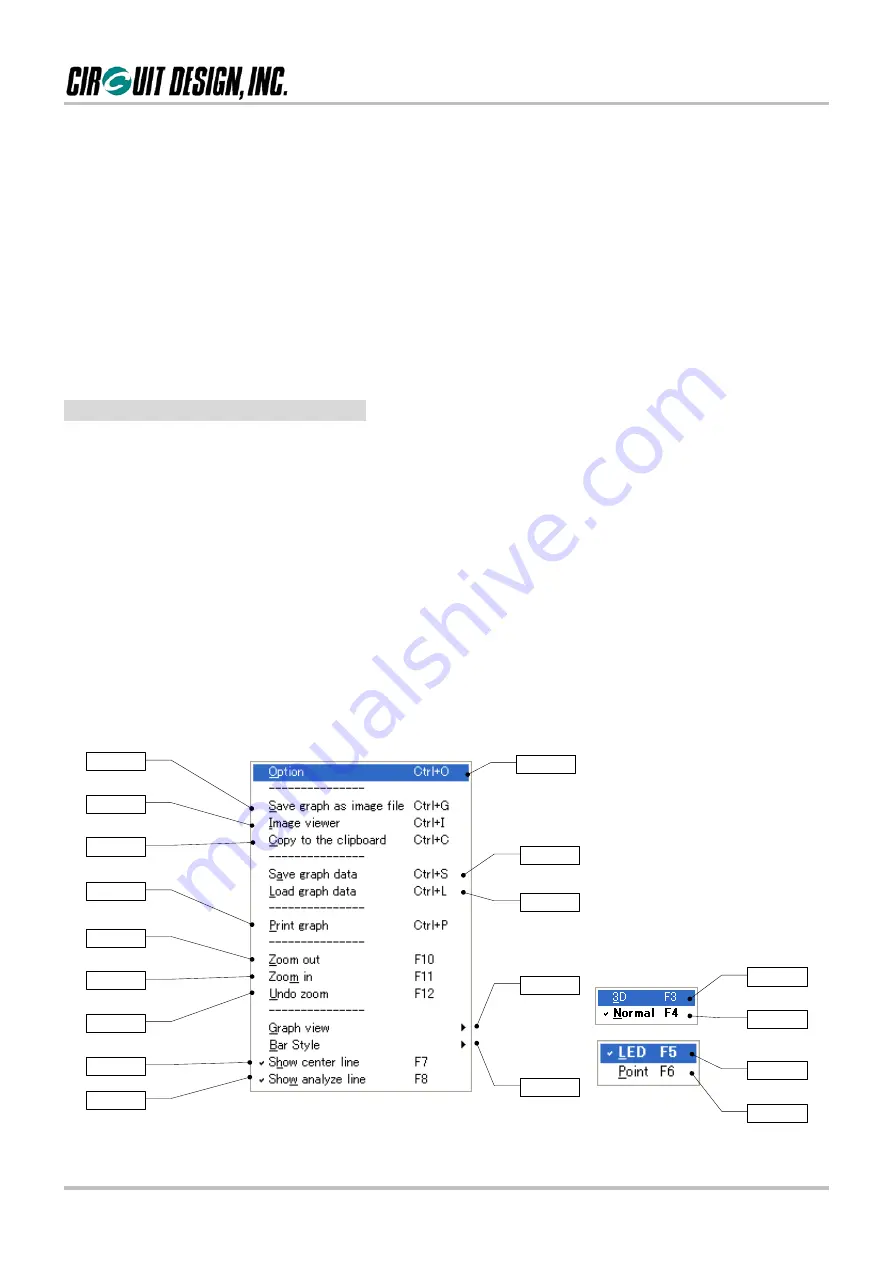
4. Pop-up menu function
The pop-up menu displayed with a right mouse click.
1
2
3
13
12
4
5
6
7
11
10
15
18
16
17
14
8
9
The keyboard shortcuts are shown at right.


