20021201
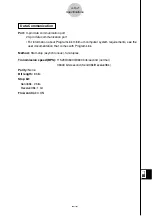
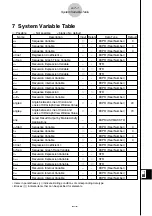
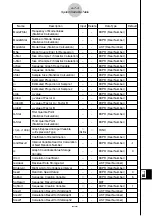
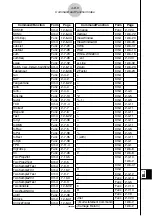
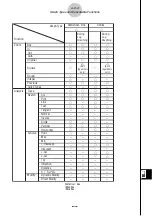
Name
Description
Input Delete
Data Type
Default
x
2
InvN
Result of InvNorm Calculation
–
–
EXPR (Real Number)
x
2
σ
n
–1
Sample Standard Deviation of Data 2
–
–
EXPR (Real Number)
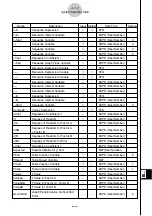
xc
Graph Coordinate Value Storage
–
–
EXPR (Real Number)
0
Variable
xdot
View Window 1-dot
x
-axis Value
䊊
–
EXPR (Real Number)
0.1
xfact
Factor Zoom X-factor Value
䊊
–
EXPR (Real Number)
2
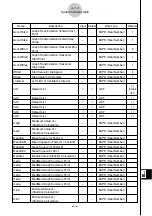
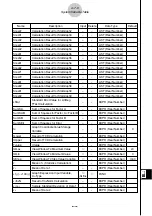
xgrid3D
3D Graph View Window Value
䊊
–
EXPR (Real Number)
25
xmax
View Window Display Range
x
-axis
䊊
–
EXPR (Real Number)
7.7
Maximum Value
3D Graph View Window Display
xmax3D
Range
x
-axis Maximum Value
䊊
–
EXPR (Real Number)
3
xmin
View Window Display Range
x
-axis
䊊
–
EXPR (Real Number)
–7.7
Minimum Value
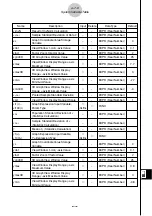
xmin3D
3D Graph View Window Display
䊊
–
EXPR (Real Number)
–3
Range
x
-axis Minimum Value
x
p
σ
n
–1
Pooled Sample Standard Deviation
–
–
EXPR (Real Number)
xscl
View Window Display Range XScale
䊊
–
EXPR (Real Number)
1
xt
1(
t
)~
Graph Expression Input Variable,
䊊
䊊
FUNC
xt
100(
t
)
Param Type
(Define)
x
σ
n
Population Standard Deviation of
x
–
–
EXPR (Real Number)
(Statistics Calculation)
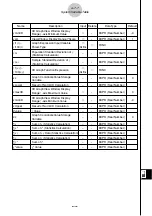
x
σ
n
–1
Sample Standard Deviation of
x
–
–
EXPR (Real Number)
(Statistics Calculation)
p
Mean of
y
(Statistics Calculation)
–
–
EXPR (Real Number)
y
1(
x
)~
Graph Expression Input Variable,
䊊
䊊
FUNC
y
100(
x
)
Y= Expression Type
(Define)
y
c
Graph Coordinate Value Storage
–
–
EXPR (Real Number)
0
Variable
ydot
View Window 1-dot
y
-axis Value
䊊
–
EXPR (Real Number)
0.1
yfact
Factor Zoom Y-factor Value
䊊
–
EXPR (Real Number)
2
ygrid3D
3D Graph View Window Value
䊊
–
EXPR (Real Number)
25
ymax
View Window Display Range
y
-axis
䊊
–
EXPR (Real Number)
3.8
Maximum Value
3D Graph View Window Display
ymax3D
Range
y
-axis Maximum Value
䊊
–
EXPR (Real Number)
3
ymin
View Window Display Range
y
-axis
䊊
–
EXPR (Real Number)
–3.8
Minimum Value
α
-7-6
System Variable Table
20030201

