20021201
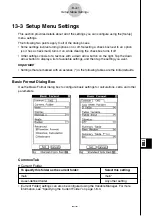
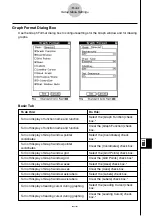
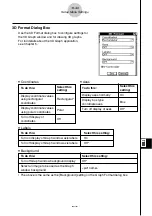
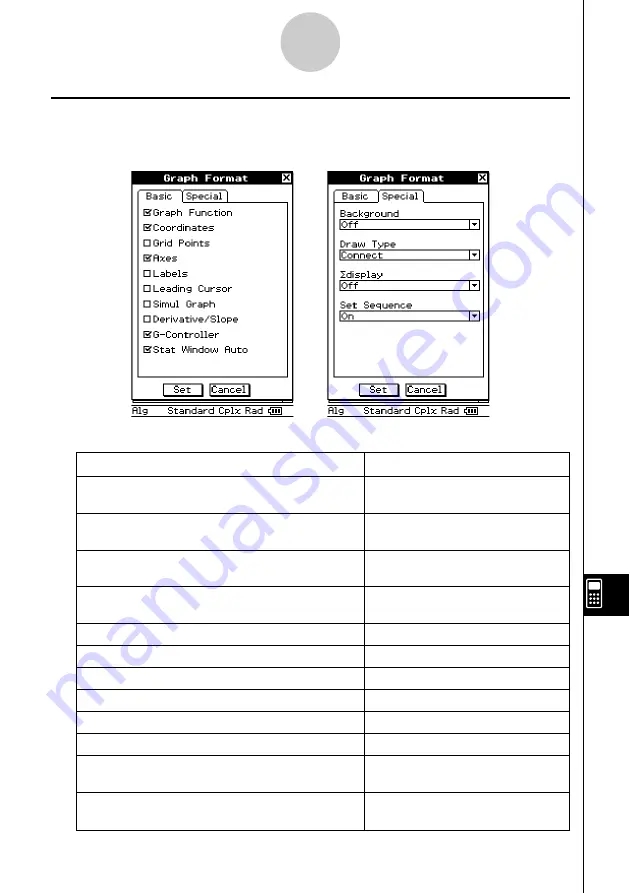
Graph Format Dialog Box
Use the Graph Format dialog box to configure settings for the Graph window and for drawing
graphs.
13-3-4
Setup Menu Settings
Basic Tab
To do this:
Do this:
Turn on display of function name and function
Select the [Graph Function] check
box.*
Turn off display of function name and function
Clear the [Graph Function] check
box.
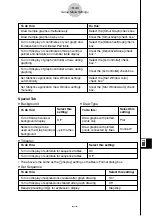
Turn on display of Graph window pointer
Select the [Coordinates] check
coordinates
box.*
Turn off display of Graph window pointer
Clear the [Coordinates] check box.
coordinates
Turn on display of Graph window grid
Select the [Grid Points] check box.
Turn off display of Graph window grid
Clear the [Grid Points] check box.*
Turn on display of Graph window axes
Select the [Axes] check box.*
Turn off display of Graph window axes
Clear the [Axes] check box.
Turn on display of Graph window axis labels
Select the [Labels] check box.
Turn off display of Graph window axis labels
Clear the [Labels] check box.*
Turn on display of leading cursor during graphing
Select the [Leading Cursor] check
box.
Turn off display of leading cursor during graphing
Clear the [Leading Cursor] check
box.*


