


20050501
13-8-1
Graphing
13-8 Graphing
The Spreadsheet application lets you draw a variety of different graphs for analyzing data.
You can combine line and column graphs, and the interactive editing feature lets you change
a graph by dragging its points on the display.
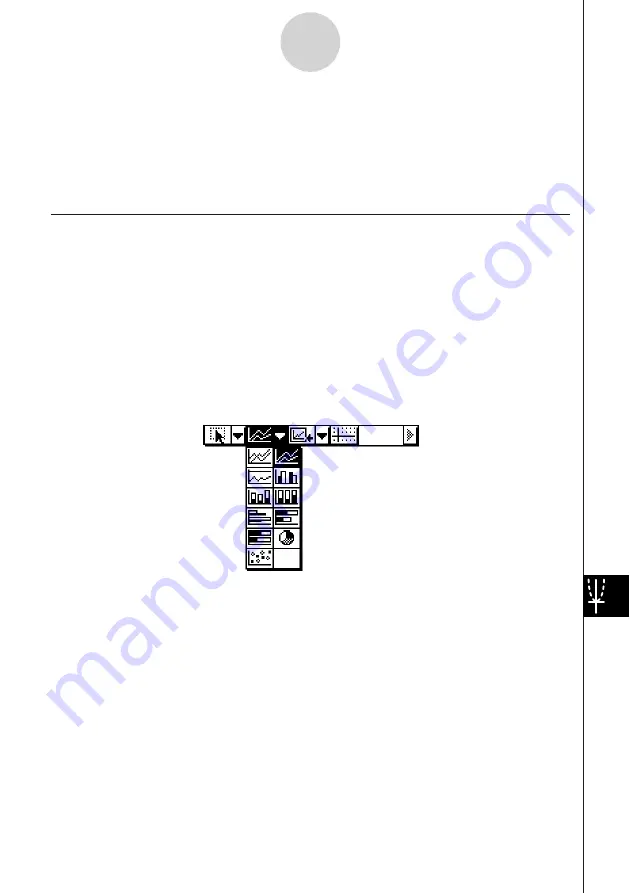
Graph Menu
After selecting data on the spreadsheet, use the [Graph] menu to select the type of graph
you want to draw. You can also use the [Graph] menu to specify whether to graph data by
column or row.
The following explains each of the [Graph] menu commands, and shows examples of what
happens to the Graph window when you execute a command.
Note
• The following examples show the appearance of graph screens after tapping
r
on the
icon panel so the Graph window fills the entire screen.
• Each command is followed by a button in parentheses to show the graph toolbar button
that performs the same action as the command.
Summary of Contents for ClassPad 300 PLUS
Page 11: ...20050501 ClassPad 300 PLUS ClassPad OS Version 2 20 ...
Page 197: ...20050501 2 10 7 Using Verify 4 Input x 2 1 and press E 5 Input x i x i and press E ...
Page 649: ...20050501 u Graph Line Clustered D u Graph Line Stacked F 13 8 2 Graphing ...
Page 650: ...20050501 u Graph Line 100 Stacked G u Graph Column Clustered H 13 8 3 Graphing ...
Page 651: ...20050501 u Graph Column Stacked J u Graph Column 100 Stacked K 13 8 4 Graphing ...
Page 652: ...20050501 u Graph Bar Clustered L u Graph Bar Stacked 13 8 5 Graphing ...


