


20050501
13-8-18
Graphing
u
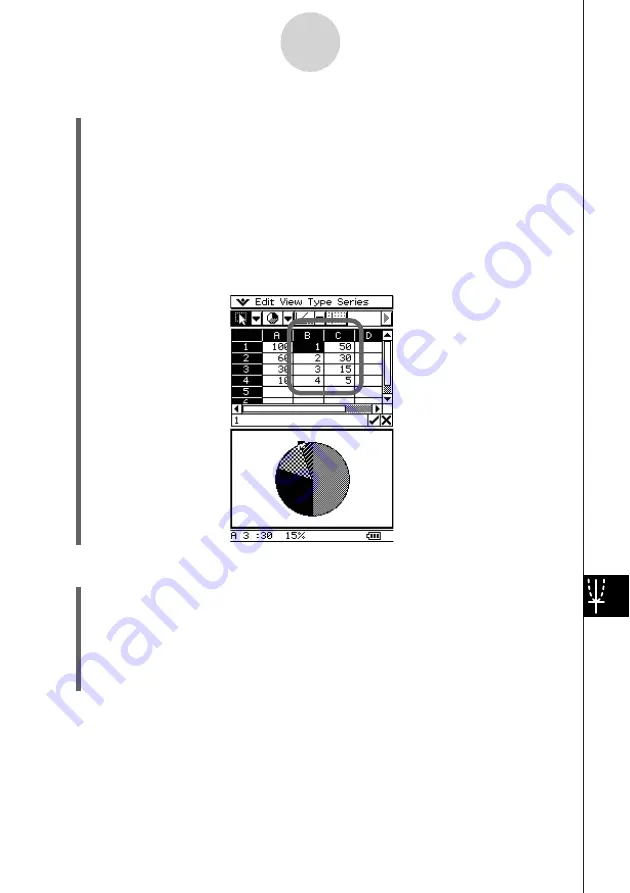
To find out the percentage of data for each pie graph section
(1) While the display is split between the pie graph and the Spreadsheet windows, tap the
pie graph to select it.
(2) On the [Edit] menu, tap [Copy].
(3) Tap the Spreadsheet window to make it active.
(4) Tap the cell where you want to paste the data.
• The cell you tap will be the upper left cell of the group of cells that will be pasted.
(5) On the [Edit] menu, tap [Paste].
• This pastes two columns of values. The numbers in the left column are pie graph
section numbers. The values in the right column are the percentages that the data in
each section of the pie graph represents.
u
To change View Window settings
(1) While a graph is on the Graph window, tap
O
, [Settings], and then [View Window].
• This displays the current View Window settings.
(2) Change the View Window settings, if you want.
• See “Configuring View Window Parameters for the Graph Window” on page 3-2-1 for
information about using the View Window.
(3) After the settings are the way you want, tap [OK] to apply them.
Summary of Contents for ClassPad 300 PLUS
Page 11: ...20050501 ClassPad 300 PLUS ClassPad OS Version 2 20 ...
Page 197: ...20050501 2 10 7 Using Verify 4 Input x 2 1 and press E 5 Input x i x i and press E ...
Page 649: ...20050501 u Graph Line Clustered D u Graph Line Stacked F 13 8 2 Graphing ...
Page 650: ...20050501 u Graph Line 100 Stacked G u Graph Column Clustered H 13 8 3 Graphing ...
Page 651: ...20050501 u Graph Column Stacked J u Graph Column 100 Stacked K 13 8 4 Graphing ...
Page 652: ...20050501 u Graph Bar Clustered L u Graph Bar Stacked 13 8 5 Graphing ...


