


G-1
Appendix G.
CRBasic Program Library
The following example programs are compatible with CR3000, CR1000, and
CR800 dataloggers without modification. The programs are available for
download at
www.campbellsci.com/downloads
. Look for "CDM-VW300
Example Programs." The programs are named with a .CR3 extension and can be
renamed as .CR1 or .CR8 without modification to run on the CR1000 or CR800
dataloggers. To use programs from this library,
1.
Select the desired program and save it to your PC.
2.
Open
CRBasic Editor
.
3.
Open the program file just downloaded to edit, if necessary.
4.
Send the program to the datalogger using the program
Send
command in
RTDAQ
or
LoggerNet
.
5.
Monitor the operation of the system with the numeric and graphical
monitors available with
RTDAQ
or
LoggerNet
.
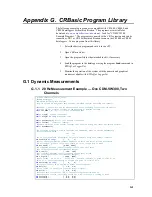
G.1 Dynamic Measurements
G.1.1 20 Hz Measurement Example
— One CDM-VW300, Two
Channels
'===20Hz-1Device2Ch_4-25-13.CR3===
'CR3000 datalogger
'CDM-VW300 vibrating-wire analyzer
'Program to read 20 Hz dynamic data from one CDM-VW300 analyzer measuring two channels
'IMPORTANT -- Ensure that the CPI address coded on the following line matches the address
'reported for the attached analyzer in the DevConfig or DVWTool software.
Const
CPI_ADDR
=
1
'<<<<<<<<<<<<<<SET CPI ADDRESS HERE
Public
Freq(2)
'dynamic frequencies
Public
Diag(2)
As Long
'diagnostic code
Public
StaticFreq(2)
'Static (1 Hz output) frequencies
Public
Therm(2)
'Thermistor readings
'Standard Deviation of the dynamic readings that occurred during the latest one-second interval
Public
DynStdDev(2)
'The following arrays are used to configure the CDM-VW300. Refer to the CDM_VW300Config
'instruction used below
' CH1 CH2
' --- ---
'Set to true (Enabled=1, Disabled=0) only those channels which have sensors connected
Dim
Enable(2)
As Long
=
{ 1, 1}
'Specify the target/desired resonant amplitude at which the sensor will be maintained
'via excitation, given in volts. This should be in the range 0.010 to 0.001
Dim
Max_AMP(2)
=
{ 0.002, 0.002}
'Low Frequency Boundary (sensor frequency should never fall below
'this value regardless of environmental changes)
Dim
F_Low(2)
=
{ 300, 300}
'High Frequency Boundary (sensor frequency should never exceed
'this value regardless of environmental changes)
Dim
F_High(2)
=
{ 6000, 6000}
'Output Format - Hz vs. Hz^2 :: Value of 0 – measured frequency is given in units of Hz,
'Value of 1 – measured frequency is squared and given in units of Hz^2
Dim
OutForm(2)
As Long
=
{ 0, 0}
'Multiplier (factor) to be applied to sensor output frequency
Dim
Mult(2)
=
{ 1.0, 1.0}
'Offset (shift) to be applied to sensor output frequency
Dim
Off(2)
=
{ 0.0, 0.0}
'Steinhart-Hart coefficients [A,B,C] for converting thermistor ohms to
'temperature in Celsius. Specifying zeroes for A,B,C results in a reading in Ohms.
Dim
SteinA(2)
=
{ 0.0, 0.0}
Dim
SteinB(2)
=
{ 0.0, 0.0}
Summary of Contents for CDM-VW300 Series
Page 2: ......
Page 4: ......
Page 6: ......
Page 12: ......
Page 59: ...User Manual 47 Figure 7 16 LoggerNet connect screens showing frequencies from CDM VW300 ...
Page 70: ...CDM VW300 Series Dynamic Vibrating Wire Analyzers 58 ...
Page 76: ...Appendix B SC CPI Datalogger to CPI Interface B 4 ...
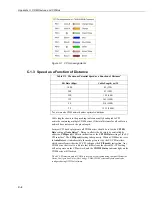
Page 80: ...Appendix C CDM Devices and CPI Bus C 4 Figure C 2 Long cable lengths of a distributed CPI bus ...
Page 86: ...Appendix E Calculating Measurement Error E 4 ...
Page 116: ...Appendix G CRBasic Program Library G 26 ...


