


Chapter 5: Optimizing cytometer settings
79
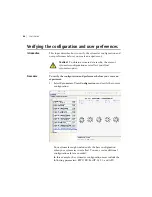
Use the gray boxes and crosshairs to guide your optimization.
2. Load the unstained control tube onto the cytometer.
3. In the
Cytometer
window, optimize the PMT voltages for the
application.
• Optimize the FSC and SSC voltages to place the population
of interest on scale.
• Optimize the FSC threshold value to eliminate debris
without interfering with the population of interest.
• If needed, increase the fluorescence PMT voltages to place
the negative population within the gray boxes. Align the
center of the negative population with the crosshair visible
in the gray box.
Note:
Do not decrease the fluorescence PMT voltages. Doing
so can make it difficult to resolve dim populations from the
negative population.
4. Unload the unstained control tube from the cytometer.
5. Load the multicolor sample onto the cytometer or load single-
color control tubes and verify each fluorochrome signal
separately.
Summary of Contents for FACSymphony A3
Page 4: ......
Page 8: ...User s Guide 8...
Page 14: ...This page intentionally left blank...
Page 46: ...This page intentionally left blank...
Page 86: ...This page intentionally left blank...
Page 97: ...Chapter 6 Recording and analyzing data 97 e Click OK 12 Print the analysis...
Page 98: ...User s Guide 98 Your global worksheet analysis objects should look like the following...


