BARTINGTON INSTRUMENTS
Page 45 of 61 OM1800/26
Other data processing programs may require the Z string or XYZ file format, with a separate
header file. When all parameters are correct, select
SAVE
or
SAVE ALL
.
If the
SKIP
or
SAVE
operations are used followed by the
SAVE ALL
operation, the correct Grid
number will be allocated to filenames of the remaining Grids.
At the end of the saving process the screen reverts to the initial download screen. Press
EXIT
to
close the program.
Note:
Check and back up saved data after downloading, before deleting the data in the data
logger. After downloading and saving, the data cannot be re-formatted by the downloading
program. However, the download process can be repeated with data being saved in
different formats whilst the data remains in the data logger.
19.4. File Formats
The provision of three file formats allows the operator to select a type compatible with export
to the preferred data processing software. All results are shown in nT/m. One or two decimal
places will be shown depending on the range used during the survey.
19.4.1. Spreadsheet Format
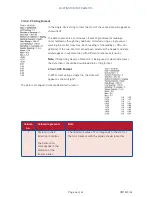
If the data has been downloaded in
spreadsheet format as one file and opened
as tab or comma delimited data in Excel, the
header and first section of data will appear as
shown (right).
The time and date is recorded from the
computer clock when the file is saved.
The remainder of the header information
corresponds to the parameter settings when
the data was recorded during the survey. The
mean, max and min values correspond to the
data from sensor 1. If the two-file format had
been selected during downloading, the header and data would appear in separate files, the data
file being given the .dat extension and the header file the .hdr extension.
The data will have been re-arranged by the downloading software to remove the effects of zigzag
data collection and the dual sensor arrangement, so that it represents the results as would be
seen if the data had been collected by a single sensor working in a parallel traverse mode. The
data is therefore organised into a Grid, which represents the plan of the site, with the top left
position being the start of the data collection and the top row corresponding to the first traverse.


