BARTINGTON INSTRUMENTS
Page 31 of 61 OM1800/26
will select 1 line/m but will traverse the Grid at 2m intervals. Thus, for a 10x10m Grid, only
five traverses will be walked but ten lines of data will appear in the results at the appropriate
positions after downloading.
Results from each sensor are logged at each position. The sensor to the left of the operator is
referred to as sensor 1 and the one to the right as sensor 2. Either parallel or zigzag traverse
patterns can be used. Provided the parameters have been set correctly, the software will
automatically allocate the correct spatial position to the data when downloading the data to a PC.
17.2.1. Setting Parameters
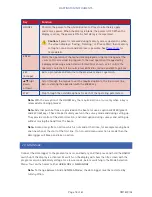
Before starting a survey, all details must be entered using the
Set parameters
menu to enable the
data to be interpreted correctly. The number of sensors is entered to allow the data subsequently
to be arranged correctly in the Grid. A spacing of 1m is assumed between sensors when using
two sensors. Different sized Grids may be recorded during a survey but may cause complications
in the plotting software.
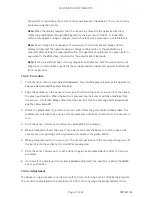
Data is collected at the distance intervals set by the operator assuming a fixed walking pace. The
pace can be set as one of the survey parameters between 0.5 and 2m/s. The operator should find
a comfortable walking pace but a good starting pace would be between 1.2 to 1.6m/s. Lines are
often laid out to mark each traverse, with pace markers placed at 1m intervals along them. If
Audio
is set to
On
, the logger will emit an audible bleep once per metre to allow the operator to
match their walking pace with the data recording rate.
The parameters of the current Grid cannot be changed once a Grid has been started, but
an incomplete Grid may be deleted and restarted at any time. Grids are saved to memory in
numerical order.
When downloaded using the software provided, the data for each Grid will form a separate file
with a header containing the details of the parameters with which the Grid was measured.
17.2.2. Survey Conventions
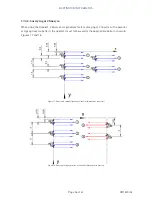
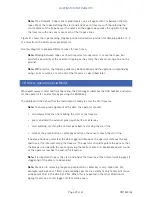
To maintain compatibility with existing practices, it is assumed that each Grid will be surveyed
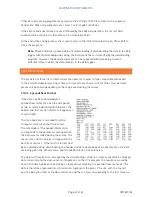
starting in a clockwise direction from one corner (Figure 12). The display of the first line of data
can be imagined as a line being printed horizontally from left to right at the top of the page
(Figure 13). The next line is measured parallel to the first and one line space away.


