The GRIB weather display
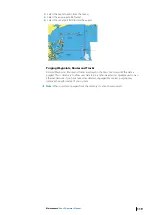
Imported GRIB weather data can be displayed as an overlay on your chart panel.
When the GRIB weather overlay is selected, the chart menu increases to show GRIB weather
options. From this menu you can select which weather symbols you want to display, set the
distance between the barbs, and adjust the opaqueness of the weather symbols.
From this menu you can also animate the weather forecast as described later in this chapter.
1
Wind barbs
2
Pressure contours
3
GRIB information window
GRIB information window
The GRIB information window shows the date and time for the GRIB weather forecast, and
the selected forecast time in brackets. A negative value in the brackets indicates historic
weather data.
If you select a position on the chart, the information window expands to include weather
details for the selected position.
Animating GRIB weather forecast
The GRIB data contains forecast information for a set number of days. It is possible to animate
the weather data and to show the predicted forecast for a specific time and date. The time
scales vary depending on the file you are using.
The time shift is shown in brackets in the GRIB information window. The time is relative to the
current time as provided by a GPS device connected to the system.
Weather
| Zeus2 Operator Manual
105
Summary of Contents for Zeus2 series
Page 1: ...ENGLISH Zeus2 Operator Manual bandg com ...
Page 2: ......
Page 125: ......
Page 126: ...0980 988 10599 003 ...


