


BCX Series Operating Manual Page 75
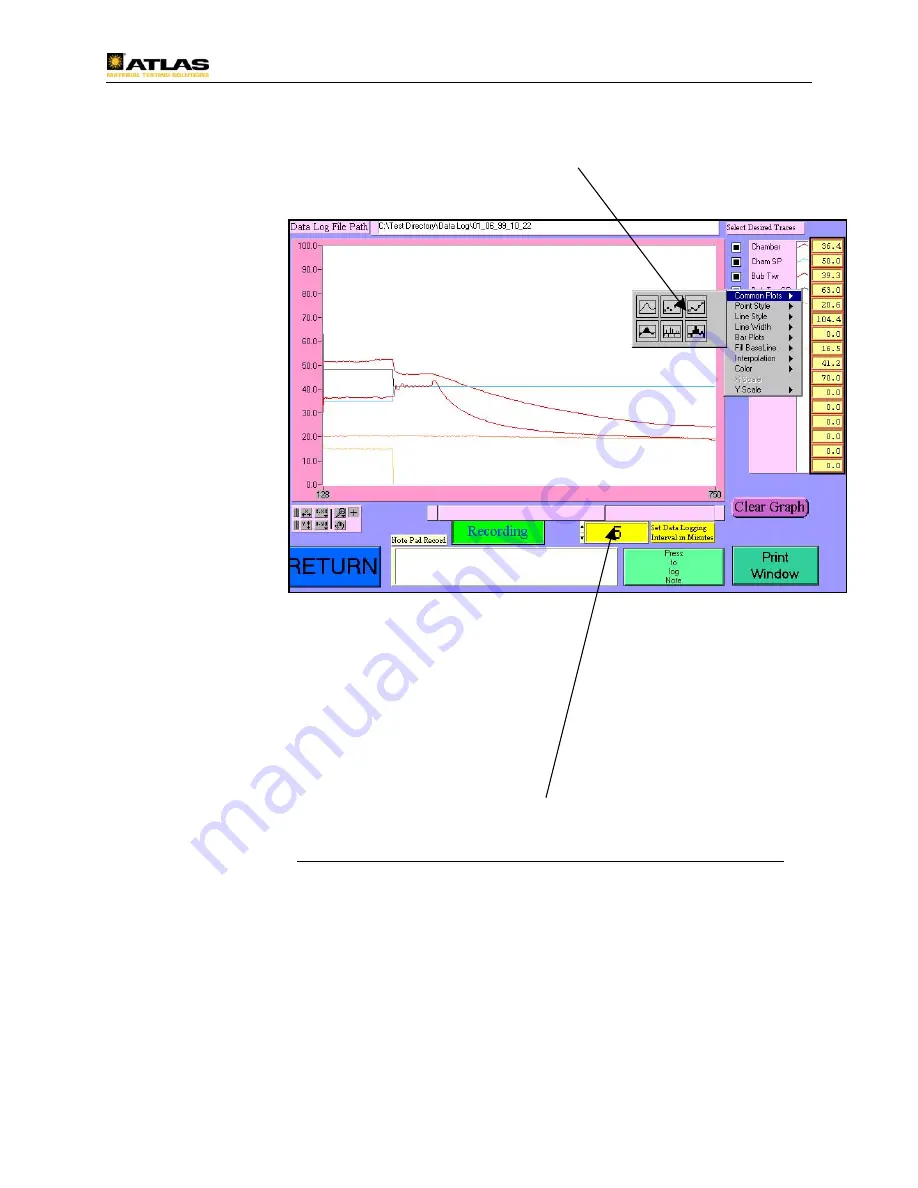
Using the mouse, position the cursor over one of the available inputs being plotted.
With the click of the left mouse key, a control window will open.
In this window, the user can change all of the plot types and colors. The best way to
get familiar
with these
features is
to
experiment
with them.
Changing
these
functions
are not
permanent.
On the
lower right
section of
this page
there is a
“Clear
Graph”
button. Pressing this button will clear all data from the graph. As new data is
produced, it will be displayed in the graphing area. Clearing the graph only affects the
display, not the physical data stored on the hard drive.
Beneath the “Clear Graph” button is a “Print Window” button. If this feature is
activated, and a properly configured printer is attached to the computer, pressing this
button will send an image of what is displayed on the screen to the printer.
The yellow “Set Data Logging Interval in Minutes” button allows the user to set the
interval at which data is stored onto the hard drive. The number entered represents the
number of minutes separating data points. Be careful with the frequency at which the
data is logged. The more frequent the data is logged, the larger the data file will be. If
the data file grows to over 1.4 megabytes, then the data file can no longer be extracted
from the computer for evaluation via the 3.5” disk drive. If this occurs, the user will
have to use the CD Write capability or install a LS 120 or ZIP disk type of media
storage device to extract the file.


