64
•
Temperature setting and temperature adjustment icons
= Displays the temperature
setting for the zone. To adjust manually, use the icons.
•
On/Off
= Activates the air conditioning in the zone.
•
Help
= Accesses the help screen. This icon is present in all the BlueFace screens,
providing information about each screen.
•
Menu
= Accesses the menu from which more parameters can be accessed (see section
12.6 – Menu).
•
Eco Mode
= Icon for activating (green leaf icon) and cancelling (crossed out green leaf
icon) the BlueFace ECO mode (see section 12.6 – Eco Mode).
•
Energy Consumption Graphics
= These graphics display estimated savings, based on
official sources, when the BlueFace ECO mode is activated (see section 12.5 – Eco Mode
and Energy Consumption Graphics).
•
Efficiency Level
= This indicator is only available when the ECO mode is active. It
indicates the estimated percentage savings for the installation if the temperature is limited
in all the zones.
•
Ambient Temperature
= Displays, independently of the other aspects of the installation,
the ambient temperature in the zone.
12.5. Eco Mode and Energy Consumption Graphics
The BlueFace includes two direct access icons that allow the user, on the one hand, to
activate and cancel the BlueFace ECO Mode for the zone, and on the other, to obtain energy
efficiency advice and guidelines (see Fig. 31).
Activating the BlueFace ECO mode restricts maximum and minimum
temperature settings for the zone. These temperatures are provided
by the relevant official bodies. When the ECO mode is activated, the
status of the efficiency icon in the main screen is changed.
Bear in mind that, if ECO Mode is activated and scheduling is
performed, then the temperature settings will be those imposed by
the ECO Mode.
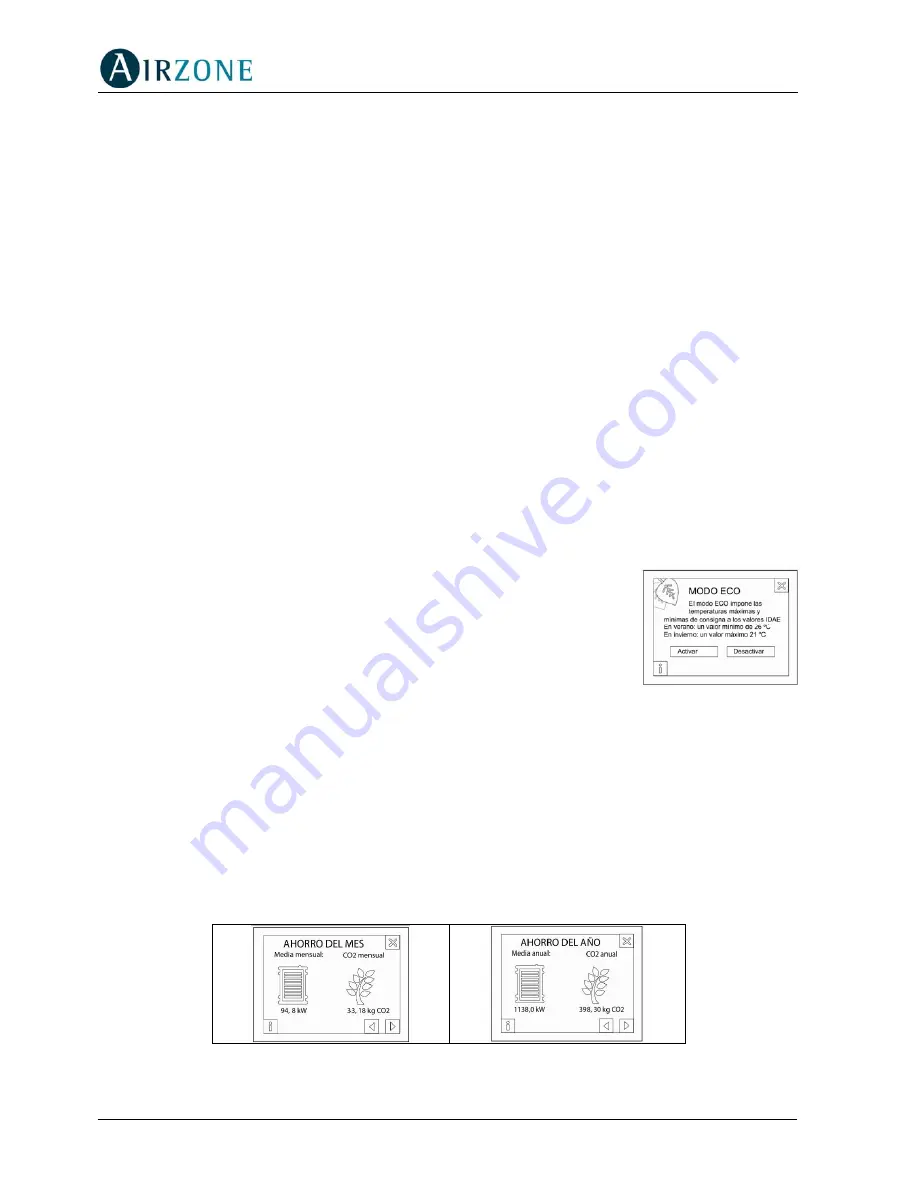
The other icon related to the BlueFace ECO Mode is the one for
displaying energy consumption graphics. This icon represents
estimated power consumption graphics according to the relevant official bodies. The three
types of energy consumption graphics that can be displayed are shown below:
•
Histogram
= This displays an estimate of the consumption with ECO mode activated
(blue bar), the estimated consumption with ECO mode disabled (by adding the green bar)
and its representation as a percentage.
•
Monthly Saving
= This screen represents the annual savings in Kw and its equivalent in
kilograms of CO
2
.
•
Yearly Saving
= This is similar to the previous screen, but shows the accumulated annual
savings.
Fig. 34
Fig. 35
Fig. 33 - ECO Mode
Activation screen
Summary of Contents for innobus
Page 1: ...Manual de Usuario Manuel d Utilisateur Manuale del Utente User s Guide V1 0 r001...
Page 2: ......
Page 67: ......


