Gen II
User Manual
24-9 – Reading Spectrum and Scales
Chapter 24
Revision 2.10, Apr 2020
24.3.9.
–Reviewing Polar Charts During and After a Job
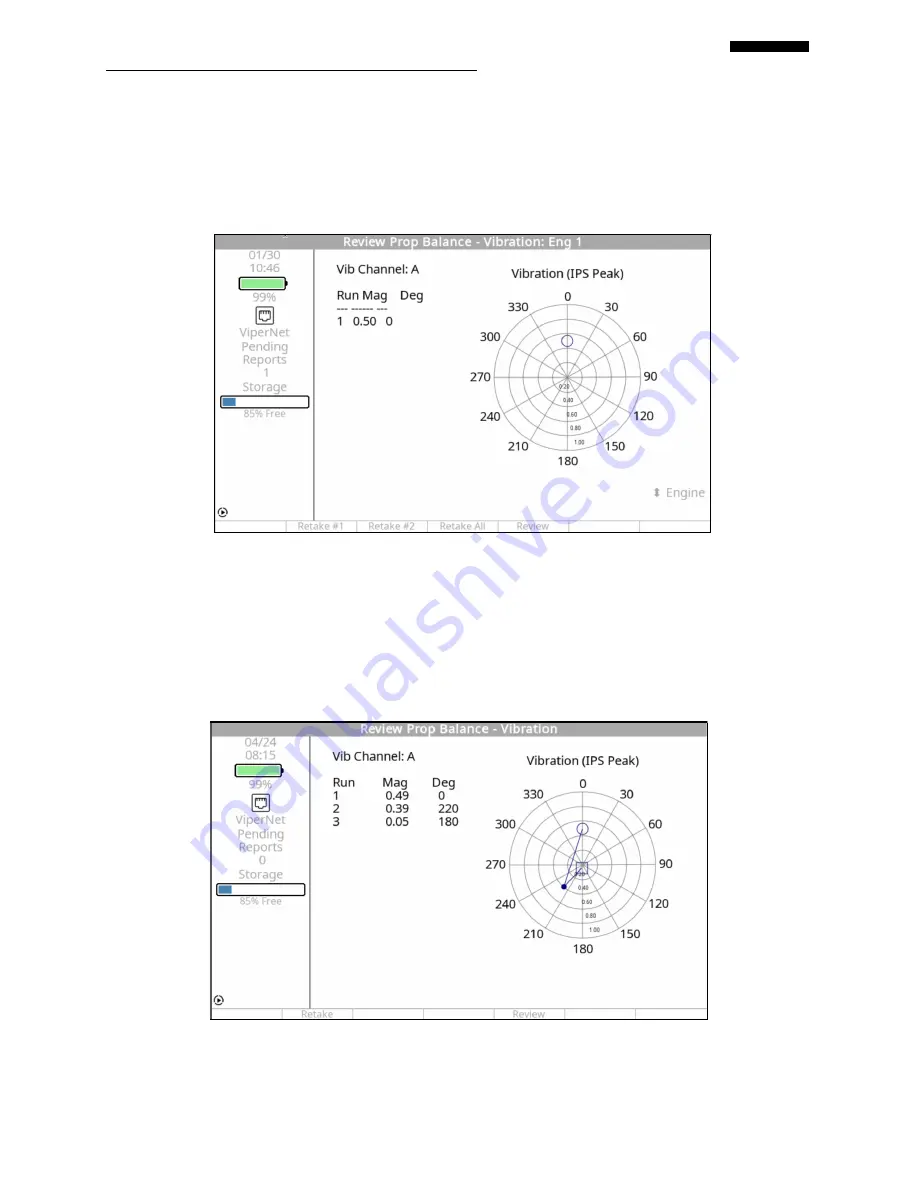
During a job, in the Review data screen, you can press the “Polar” key to display the vibration
data in a polar chart as shown below. The location of the “Polar” key and the type of chart will
depend on the analyzer function being used.
7
The vibration will be indicated by a circle displayed at a location on the polar that corresponds
with the numerical values in the “Mag” and “Deg’ columns on the left.
As the job continues, each successive run will be displayed in a single polar allowing you to
visually track the balance progress. The first run is indicated by a circle and the most recent run
will be indicated by a square.


