


4
09:46 Rt1 Cleaning Complete
09:46
PaA
High Inlet Temp
08.30
A2
09:00 A1
75.5 %RH A2
495.8 m3/day
09:00 A3
110.0
C
A4
20.0
CO2
09:00 A5
25.2
l/h
A6
7.0
pH
A1
A3
A4
Measured
Value
Time
Units
Measured
Value
Units
Channel
Number
Channel
Number
Message Assigned
to Alarm
Alarm Type/
Identifier
Time of
Alarm
09:50 24-Nov-99 Batch 18/3 Complete
09:55 300mm/h
A1
0.0 / 100.0
l/h
A2
0.0 / 14.0 pH
A3
0.0 / 250.0
C
A4
0.0 / 20.0 CO2
A5
0.0 / 100.0
%RH
A6
0.0 / 500.0
m3/day
10:00
Totalizer
Tag
Flow
Units
0
20
40
60
Tank Flow
11:00
T2
000035.19 m3
Tank
A5
Channel
Number
Range
12:00
24 NOV 99
120mm/h
Time
Date
Chart Speed
Units
08:00 Start Cleaning Cycle
Flow
Total
Totalizer
Identifier
Time
End of Chart Warning
– line printed on last 2m (roll chart)
or 1.5m (fanfold chart)
Channel Tag
– one channel tag printed every 240mm
Time, Date & Chart Speed
– printed on power-up
and at approximately 240mm intervals
Chart Scale
– up to 6 different scales can be printed
at intervals between 10mm and 240mm (programmable)
Totalizer Values
– printed on the hour at programmable
time intervals (between 5 and 720 minutes), on demand
from a digital signal or from within the
Print Messages Page
–
see Section 3.10
Time
– printed on the nearest hour or half hour
after a minimum of 60mm of traces produced
Channel Data
– engineering range and units, printed
on demand from a digital signal or from within the
Print Messages Page
Chang
e of Chart Speed (and time of change)
Operator Message
– printed on demand from a digital signal
or from within the
Print Messages Page
– see
S
ection 3.10
Process Alarms (Pa) or Real Time (Rt) Alarms
– Printed in
red if an alarm condition occurs. Any message assigned to
the alarm is also printed
Channel Values
– printed on the hour at programmable
time intervals (between 5 and 720 minutes), on demand
from a digital signal or from within the
Print Messages Page
– see
Se
ction 3.10
Time
– printed on the nearest hour or half hour
after a minimum of 60mm of traces produced
Trace Identifiers
Event Marker
– Identified with either:
'<' – input A active, pen in
'>' – input B active, pen out
20 Character Message Block
– up to 14
different messages
can be printed on demand from a digital signal
1
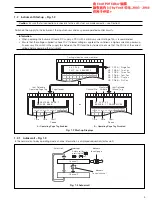
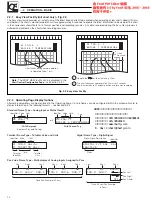
CHARTS AND PENS
1.1
Chart Printout – Fig. 1.1
In addition to displaying up to six traces, the chart printout can contain text messages printed as events occur, such as process
alarms, or at regular intervals, such as date/time and scale.
Fig. 1.1 Chart Text


