


Main Chiller Controller Technical Guide
SECTION 1: TOUCH SCREEN INTERFACE
13
Setpoint & Alarm Screens
Con
fi
gurations Setpoint Screen
Press
the
<Configurations>
icon to access the
Expansion Modules Setpoint Screen
. See
Figure 20
.
Press
<DONE>
to return to the
Chiller Status Screen
or select another setpoint screen.
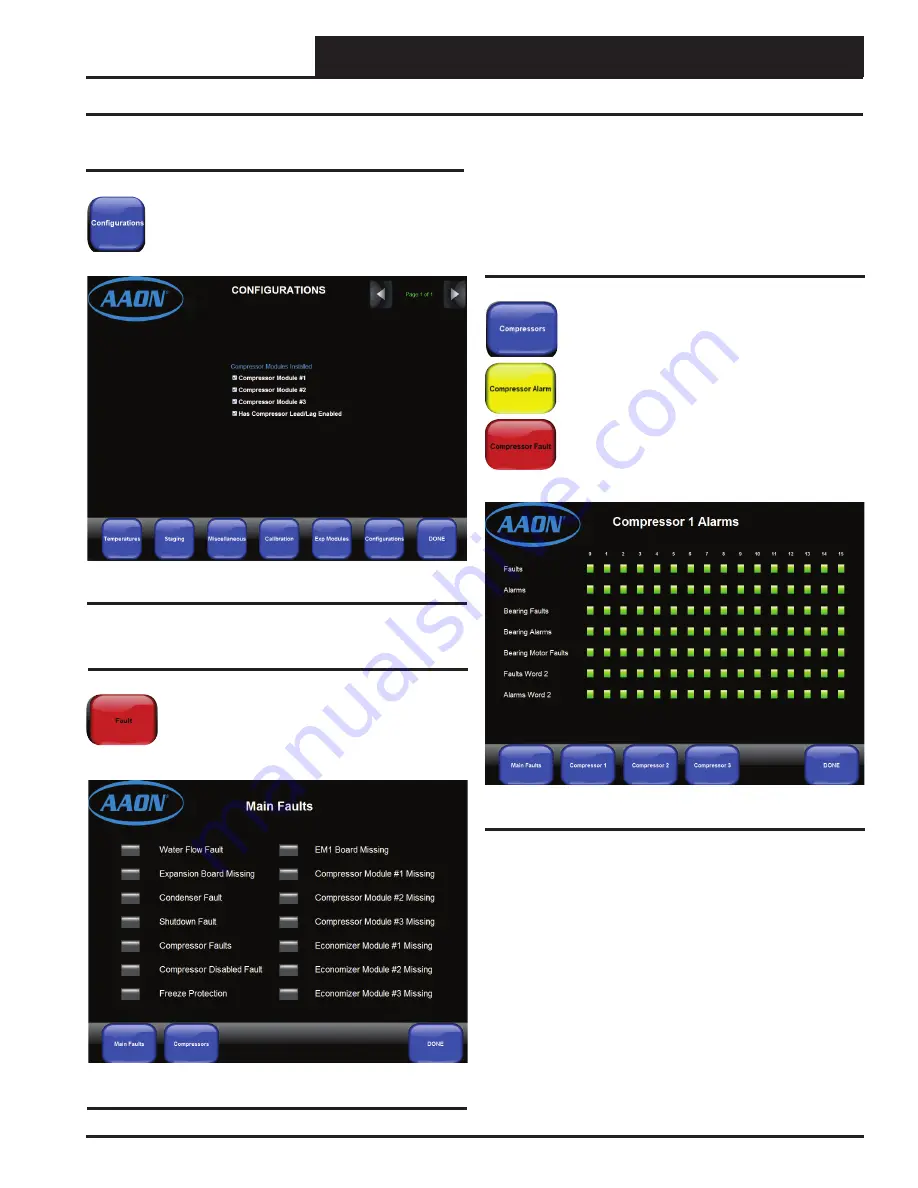
Figure 20: Confi guration Setpoints Screen
Main Faults Screen
Press
the blue
<Alarms/Faults>
or red
<Fault>
icon
at the bottom of the
Chiller Status Screen
(
Figure
2, page 8
) to access the
Main Faults Screen
. See
Figure 21
.
Press
<DONE>
to return to the
Chiller
Status Screen
.
Figure 21: Main Faults Screen
Compressor Alarms
Press
the blue
<Compressors>
icon, yellow
<Compressor Alarm>
icon, or red
<Compressor
Fault>
icon at the bottom of the
Main Faults Screen
to access the
Compressor Alarms 1 Screen.
See
Figure 22
. From the bottom of the
Compressor
Alarms 1 Screen
, you can select the
<Compressor
2>
and
<Compressor 3>
icons to access these
compressor’s alarms screens. These icons, too,
will be yellow to specify alarms or red to specify
faults.
Press
<DONE>
to return to the
Chiller Status
Screen
.
Figure 22: Compressor 1 Alarms Screen
On the
Main Faults Screen
, if there are one or more faults present, the
box next to each active fault will appear red. From the bottom of this
screen you can access the Compressor alarms. The
<Compressors>
icon will be red if there are Compressor Alarms present.
The green box in each fault row will appear red if there is a fault.
The green box in each alarm row will appear yellow if there is an
alarm.
Touch
each red box to reveal the alarm/fault category. The
list of compressor alarms and faults are found on
pages 15 & 16
.


