Device
Placement
on
the
Layout
Model
3Com
®
AirProtect
Planner
User
Guide
84
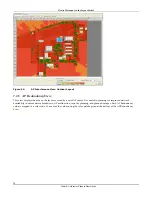
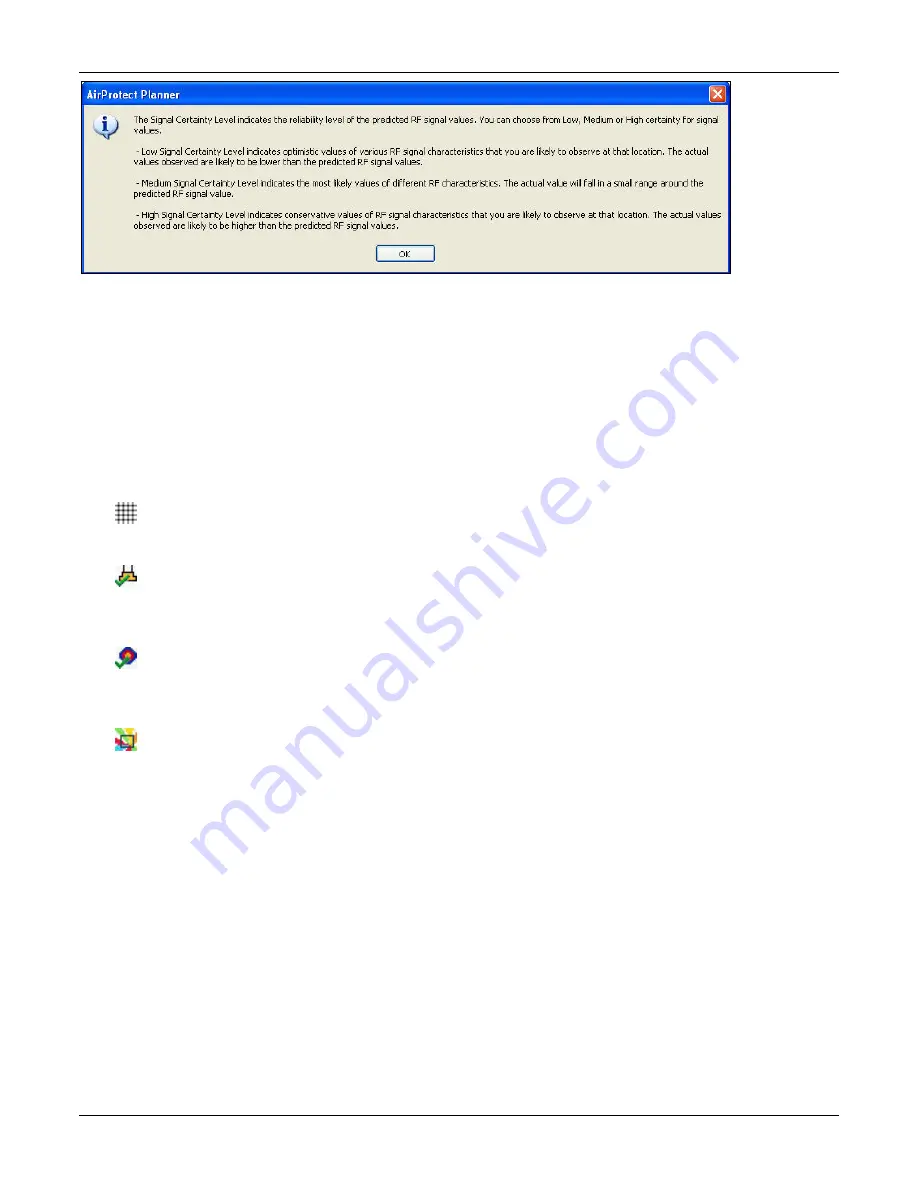
Figure 107.
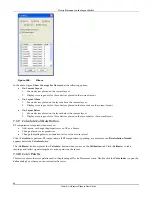
Status and Control Pane: Signal Certainty Level I-Pop-up
7.3.2
Accuracy
The
Accuracy
tab
on
the
Toolbar
allows
you
to
set
four
levels
of
accuracy
for
RF
computations
with
1
being
the
lowest
(default)
and
4
being
the
highest.
Computation
time
for
creating
RF
maps
increases
with
the
accuracy
level.
7.3.3
Opacity
The
Opacity
option
helps
you
view
the
floor
model
and
coverage
together.
Select
the
Opacity
value
from
the
drop
‐
down
list.
Opacity
value
of
0%
makes
the
coverage
colors
transparent
while
a
value
of
100%
makes
the
coverage
colors
opaque.
7.3.4
Show
Grid
Click
from
the
Toolbar
to
view
the
grid
on
the
layout.
This
helps
view
the
cell
distance.
7.3.5
View
Layout
Model
Click
from
the
Toolbar
to
view
the
layout
model.
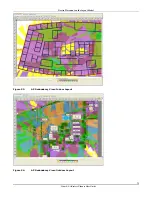
This
helps
you
verify
the
locations
of
the
devices
placed
on
the
layout
along
with
the
original
.gif
or
.jpg
image.
7.3.6
Show
RF
Signal
Click
.
from
the
Toolbar
to
view
the
RF
signals
of
the
layout.
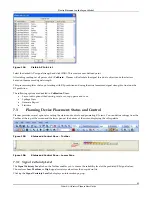
This
helps
you
view
the
color
‐
coded
signal
coverage
of
the
devices
on
the
layout,
across
different
views.
7.3.7
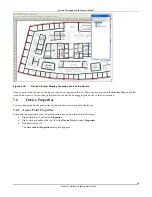
Show
Spillage
View
Click
from
the
Toolbar
to
invoke
the
Spillage
View
.
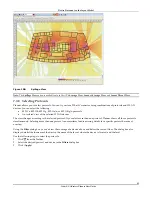
This
view
displays
color
‐
coded
RSSI
distribution
over
and
around
the
perimeter
of
the
current
layout.
It
helps
you
analyze
the
security
exposure
due
to
spillage
of
the
signals
outside
the
perimeter
of
the
current
layout.
You
can
minimize
the
security
threats
from
war
drivers
and
eavesdroppers
based
on
the
results
of
the
Spillage
View
.
Planner
assumes
the
area
outside
the
layout
to
be
free
space
for
RF
prediction.
Higher
Sensor
coverage
outside
the
perimeter
of
the
layout
indicates
a
better
coverage
for
security
exposure.
With
larger
coverage,
a
device
that
is
far
away
from
the
layout
perimeter
can
also
be
detected
by
the
Sensor
and
the
transmission
can
be
prevented,
if
found
malicious.


