Device
Placement
on
the
Layout
Model
3Com
®
AirProtect
Planner
User
Guide
77
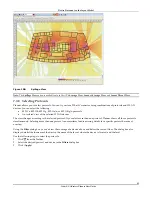
Figure 96.
AP SINR View: Outdoor Layout
7.2.7
Sensor
Coverage
View
This
view
helps
plan
the
placement
of
Sensors.
It
displays
the
zone
of
visibility
for
each
Sensor.
Sensors
can
cover
802.11a,
802.11b,
802.11g,
802.11a/n,
and
802.11b/g/n
protocols.
Sensors
are
placed
on
the
layout
such
that
they
can
detect
WLAN
activity
at
each
point
on
the
layout
and
its
perimeter
and
can
prevent
unauthorized
activity.
Recommended:
Plan
Sensor
placement
such
that
each
point
on
the
layout
and
its
perimeter
is
visible
to
two
or
three
Sensors.
You
can
do
this
using
the
Sensor
Redundancy
View
.
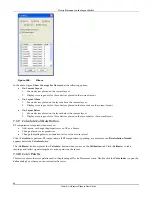
There
are
two
ranges
for
Sensors’
RF
visibility:
Detection
and
Prevention
.
You
can
view
either
the
Prevention
range,
or
the
Detection
range,
or
both
using
the
two
checkboxes:
Show
Prevention
and
Show
Detection
provided
at
the
bottom
of
the
screen.
•
Detection
Range:
Area
from
which
Sensors
can
reliably
detect
any
wireless
activity.
Detection
is
based
on
data
rate
(link
speed)
of
protocols.
Specify
the
data
rate
or
use
the
Device
Transmit
Power
(dBm)
slider
to
control
the
data
rate
for
which
you
want
to
see
detection.
Sensors
can
detect
all
the
devices
(with
transmit
power
set
greater
than
that
in
the
slider
bar)
located
within
its
detection
range.
For
further
specific
results,
select
certain
protocols
and
then
specify
the
data
rates
for
each.
Note:
If
you
disable
a
protocol,
the
view
will
change
accordingly
and
show
prevention
and
detection
only
for
the
active
protocols.
•
Prevention
Range:
Area
over
which
Sensors
can
reliably
prevent
any
unauthorized
wireless
activity
and
block
unwanted
WLAN
devices.
You
can
also
use
the
Prevention
Reliability
slider
to
control
the
prevention
range.
As
the
prevention
reliability
increases,
the
prevention
range
reduces.
¾
Low
Prevention
Reliability
indicates
the
optimistic
estimates
of
the
prevention
range
of
Sensors.
The
actual
prevention
range
is
likely
to
be
less
than
the
predicted
prevention
range.
¾
Medium
Prevention
Reliability
indicates
the
most
likely
prevention
range
of
Sensors.
The
actual
prevention
range
is
likely
to
be
comparable
with
the
predicted
prevention
range.
¾
High
Prevention
Reliability
indicates
conservative
estimates
of
the
prevention
range
of
Sensors.
The
actual
prevention
range
is
likely
to
be
greater
than
the
predicted
prevention
range.


