12-30
IM WT3001E-51EN
Explanation
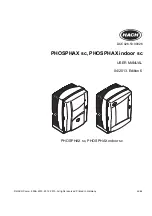
• Display during Measurement
The figure below is a display example of the measurement of dmax caused by manual
switching in progress.
Element number whose measured data is displayed
Flicker measurement status: Start
Total elapsed measurement time
Limit
Observation period being measured
An asterisk is displayed to the right of the number. The dmax columns of that
line show the maximum values in the observation period. If the instantaneous
value every 2 s exceeds the maximum value, the value is updated.
Observation periods that have finished the measurement
For the dmax values up to the current observation period, max and min are
indicated to the right of the maximum and minimum dmax values, respectively.
Number of observation periods
that have completed the
measurement and bar graph
Elapsed time in an observation
period and bar graph
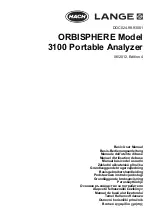
• Judgement Display When the Measurement Is Complete
The figure below is a display example when the measurement of dmax caused by
manual switching is complete.
Judgement of the average of dmax
Displays the average of 22 dmax values excluding the maximum and minimum values.
The value is compared to the limit, and the judgement (pass or fail) is displayed.
Flicker measurement status: Complete
Measured element
Element judgement
Displays the judgement of the average of
dmax for the element whose measured
data is displayed.
Total judgement
If the judgement of all elements being
measurement is pass, Pass is indicated.
Otherwise, Fail is indicated.
12.6 Executing the Measurement of dmax Caused by Manual Switching