G
ETTING
S
TARTED
IEC61000-3
S
OFTWARE FOR
W
INDOWS
U
SER
M
ANUAL
Page 62
VPN 98-025/7
Voltech Instruments
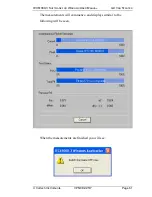
Switch off the mains and click on the OK button. As with other
measurements, you will again be prompted for a title for the saving of
the result.
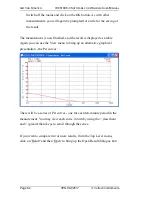
The measurement is now finished, and the result is displayed as a table.
Again you can use the View menu to bring up an alternative graphical
presentation - the Pst curves:
There will be a series of Pst curves - one for each ten-minute period in the
measurement. You may view each curve in turn by using the < (less than)
and > (greater than) keys to scroll through the series.
If you wish to compare two or more results, from the Top Level menu,
click on 'Result' and then 'Open' to bring up the Open Result dialogue box:


