G
ETTING
S
TARTED
IEC61000-3
S
OFTWARE FOR
W
INDOWS
U
SER
M
ANUAL
Page 52
VPN 98-025/7
Voltech Instruments
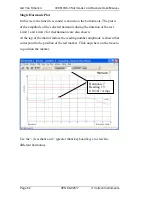
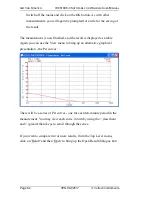
Single Harmonic Plot
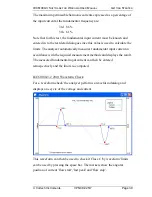
In this view the time (in seconds) is shown on the bottom axis. The plot is
of the amplitude of the selected harmonic during the duration of the test.
Limit 1 and Limit 2 for that harmonic are also shown.
At the top of the main window, the reading number amplitude is shown that
correspond to the position of the red marker. Click anywhere on the trace to
re-position the marker.
Use the < (less than) and > (greater than) keyboard keys to view the
different harmonics.
Harmonic 7
Reading 19
0.103617 Amps


