Chapter 1
Getting Started
7
SR860 DSP Lock-in Amplifier
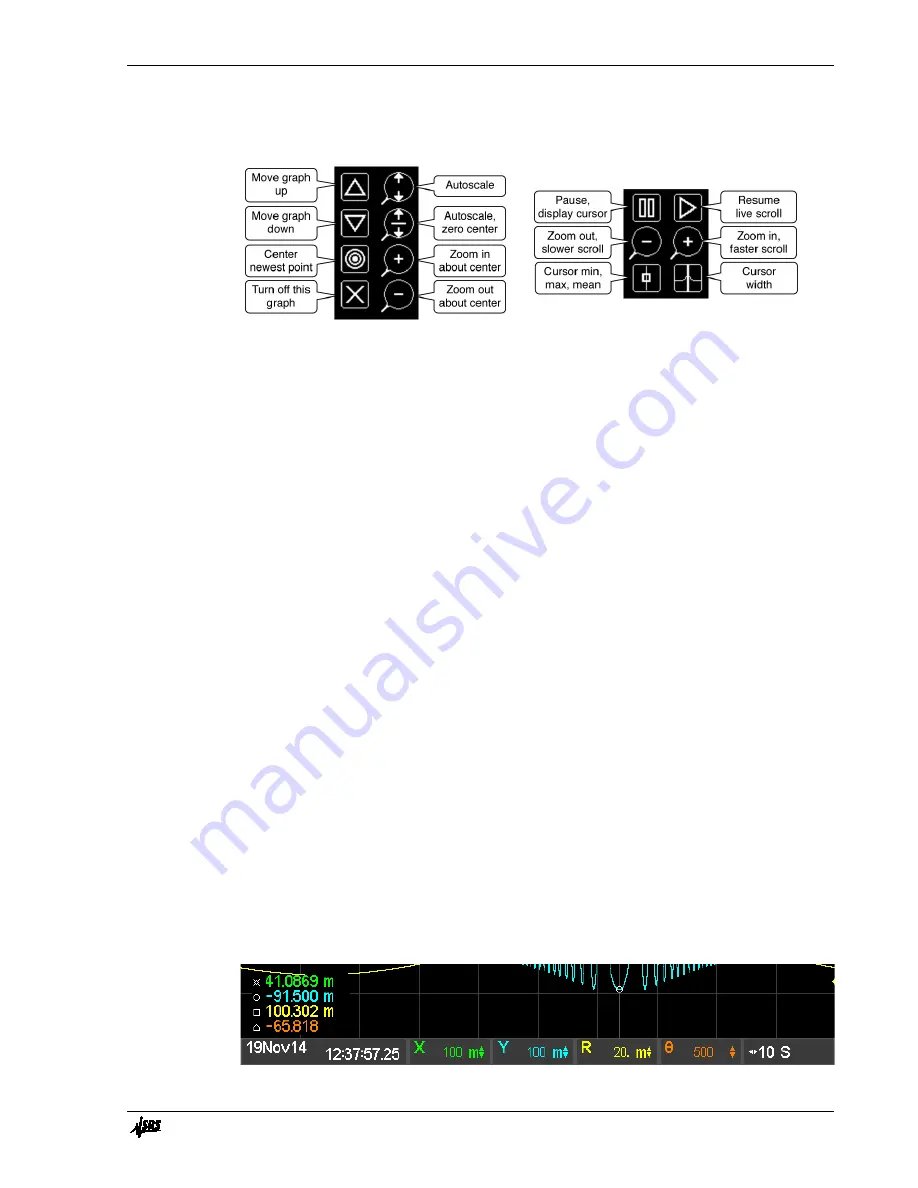
Use the palette functions to scale the selected data channel’s graph. Touch the scale tile
again to dismiss the palette.
Vertical Scale Palette
Horizontal Scale Palette
Vertical Scale Palette
Vertical scale changes are applied to each data channel separately. {Autoscale} adjusts
the scale and center so the graph occupies as much of the screen as possible. {Autoscale
Zero Center} forces the center of the graph to be zero and then sets the scale to show the
data. The location of zero is indicated by the small triangle on the right edge. It points left
where zero is. It points up or down if zero is above or below the graph.
{Zoom In} and {Zoom Out} change the scale about the center. Use {Center Newest
Point} to bring the current point to the center of the graph before zooming in or out.
{Move Up} and {Move Down} simply move the graph up and down on the screen. The
graph can also be moved simply by touching and dragging on the screen while the
vertical scale palette is displayed.
Each graph can also be turned off. Touch the scale tile to turn the graph back on.
All changes to the graphs are non-destructive. They simply change the way data is
visualized. Stored parameter values are not altered by scale changes.
Horizontal Scale Palette
Horizontal scale changes are applied to the entire strip chart display and all data channels.
{Zoom In} and {Zoom Out} change the horizontal scale and scroll speed.
{Pause} stops the chart scrolling and pauses the graph. When the graph is paused, the
cursor can be used to readout data values. These readouts correspond to the min, max or
mean of the data in the time bin at the cursor location. The time of the cursor location is
displayed in the tile at the left edge of the scale bar below the graph. Touch this tile to
switch between elapsed time from the right edge to absolute time (time and date when the
point was taken). Use {Cursor MinMaxMean} and {Cursor Width} to change the cursor.
Note that the cursor marker may not lie on the data graph for wide cursors since the
marker shows the min, max or mean of
all
the data within the cursor width.
Содержание SR860
Страница 1: ...Revision 2 01 Operation Manual SR860 500 kHz DSP Lock in Amplifier ...
Страница 5: ...Safety and Preparation For Use iii SR860 DSP Lock in Amplifier ...
Страница 6: ...iv Safety and Preparation For Use SR860 DSP Lock in Amplifier ...
Страница 54: ...36 Getting Started Chapter 1 SR860 DSP Lock in Amplifier ...
Страница 118: ......
Страница 172: ......
Страница 186: ...168 The FFT Display Appendix B SR860 DSP Lock in Amplifier ...
Страница 192: ......
Страница 222: ...204 Circuit Description Appendix H SR860 DSP Lock in Amplifier Partial schematics follow this page ...


