1. The ROX™ Web Interface
ROX™ v2.2 User Guide
26
RuggedBackbone™ RX5000
Tables and forms relevant to the selected menu item appear below the navigation window.
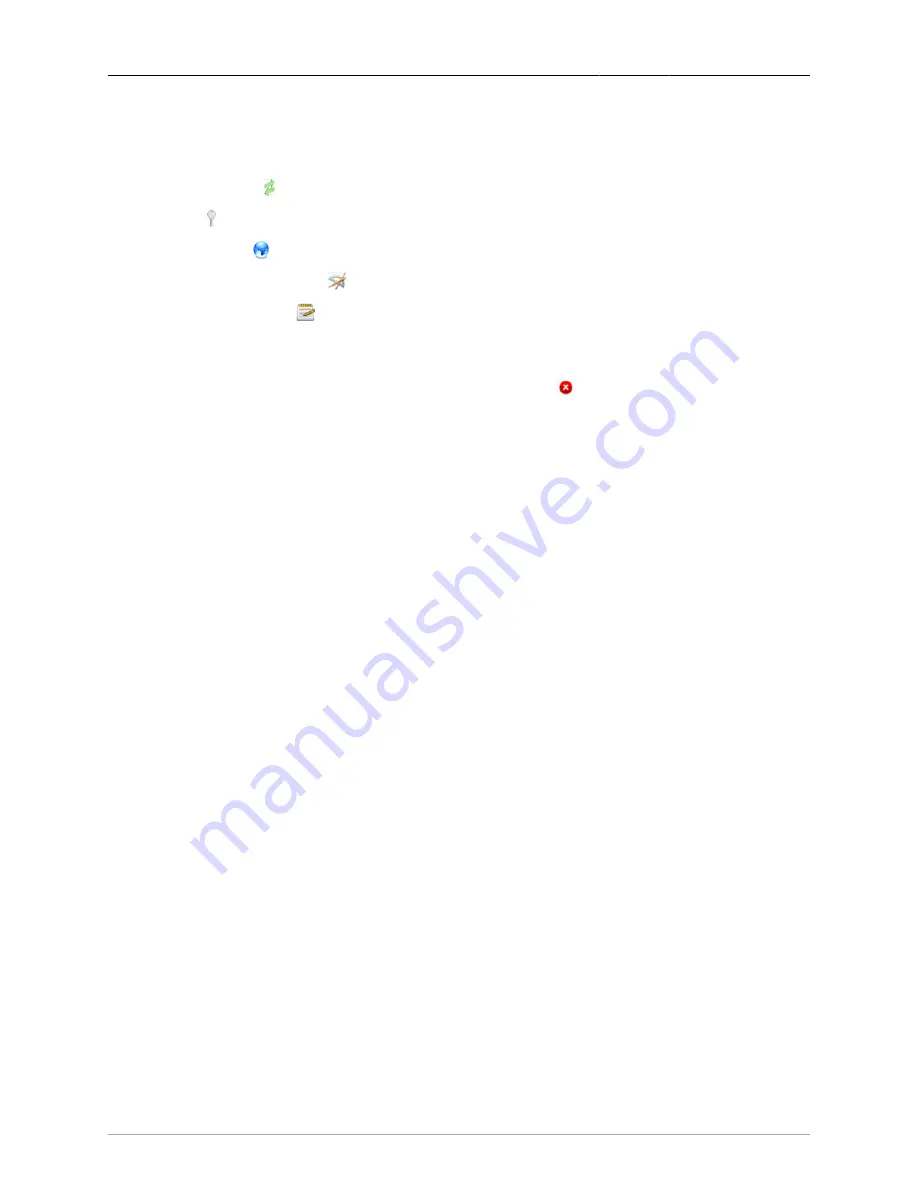
The icons in the upper left corner of the forms and tables are used to signify the type of content
represented in each form or table.
• The green arrow icon signifies operational data.
• The key icon signifies the key in key settings.
• The blue globe icon signifies the global group (a high-level grouping of items).
• The pencils and protractor icon signifies configuration data.
• The paper and pencil icon signifies results. This icon is usually found on a form where there are
parameters to enter.
Every web page in the ROX™ user interface has a header, illustrated above, containing:
• The ROX™ and RuggedCom logos and a Logout button,
which terminates the current web
session.
• The tabs: Configure Running and Tools.
The Configure Running tab selects the configuration interface described above. A menu bar below the
page header displays the following editing mode controls:
• View: View configuration settings only.
• Edit Private: Enter a configuration editing mode where you can make changes to the system. Your
changes are applied to the active system only when you commit them. Edit sessions are self
contained: the changes made in your edit session are not visible to other users in other edit sessions.
• Edit Exclusive: Enter a configuration editing mode where, after committing your changes, you can
specify a timeout period to test the changes. At the end of the timeout period, your changes to revert
back to the original settings. Use this mode when you want to test changes before committing them
permanently. When you click Commit, a dialog prompts you to set a commit timeout. Type a value
and select a unit of time. ROX temporarily applies your changes to the active system for the specified
time. To cancel the commit and discard the changes, click Abort Commit before the time elapses.
To permanently commit your changes, click Commit before the time elapses.
In many cases, the tables appear on a screen closer to the top level and clicking on one of the submenus
brings up the form(s) associated with the table. For example, clicking on the Chassis menu and then
the Hardware submenu will display the Slot Hardware table. Further clicking on the pm1 submenu will
display the Slot Hardware form.
The Tools tab displays a menu of tools in the menu bar, with the following structure:
• Device Info: displays text from various system logs. You can specify the number of lines to view and
a text filter.
• Messages Viewer: displays all events from
/var/log/messages
.
• Syslog Viewer: displays syslog events from
/var/log/syslog
.
• Authlog Viewer: displays authentication events from
/var/log/auth.log
.
• Layer2log Viewer: displays Layer 2 events from
/var/log/layer2
.
• Kernlog Viewer: displays kernel events from
/var/log/messages
.
• Accessories
• Ping: an ICMP echo tool for IPv4 addresses
• Ping6: an ICMP echo tool for IPv6 addresses


