Data view display
Data view display
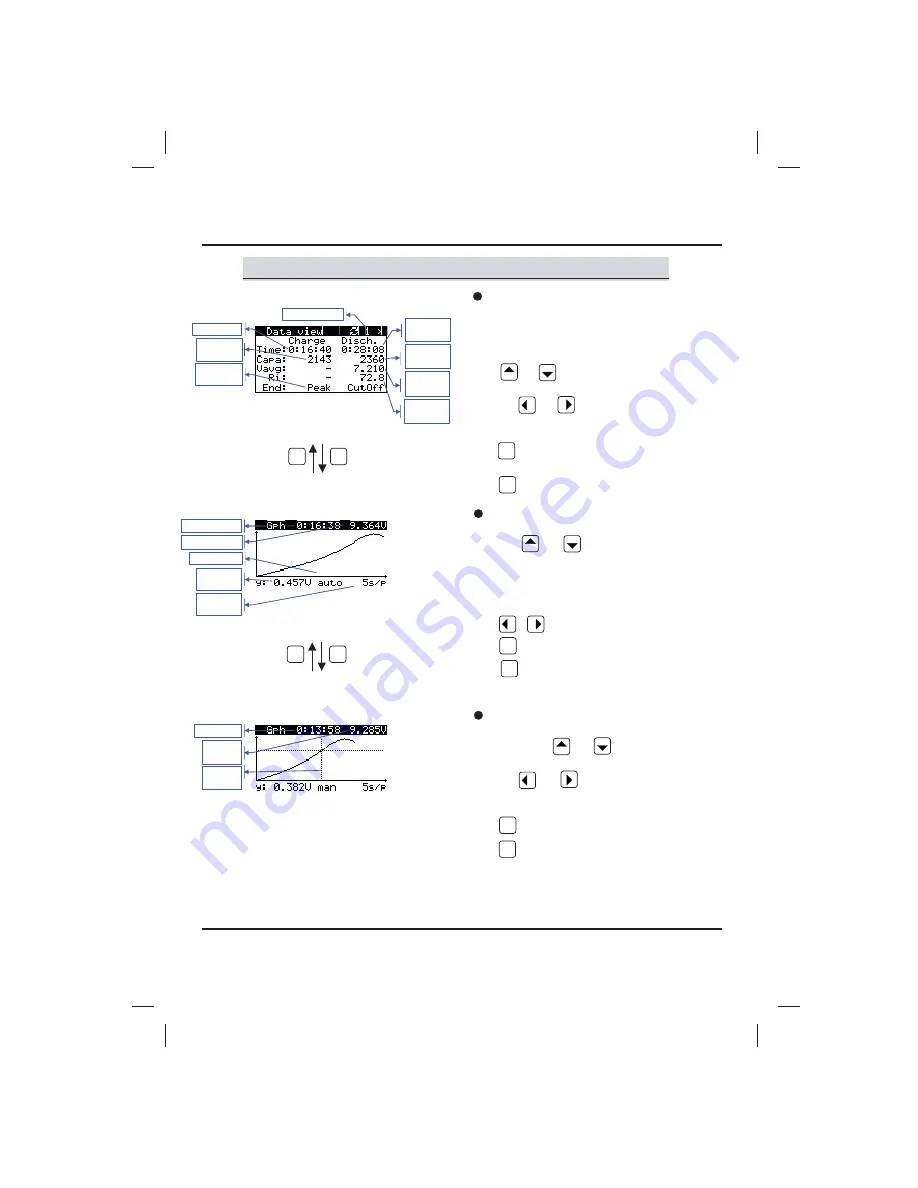
This is where you are when you first enter the
display data view mode or after the ending of a
cycle program. The display menu appears in table
format. The left data slot (Charge) includes the charge
data, the right one (Disch.) the discharge data.
- and buttons have no function in the
data view mode.
- With and you are able to “turn the pages”
from 1 to 10. Each page corresponds to the
regarding charge/discharge cycle.
- switches to the display of the visual
graphical illustration.
- switches to the adjustments mode.
Cursor
voltage
Cursor time
Switch-off
method
Internal
resistance
Cycle number
Discharge
time
Discharge
capacity
Average
voltage
Charge time
Charged
capacity
Battery voltage
Resolution
voltage
Charge time
Scrollmodus
Resolution
time
Visual graphical illustration (graph)
Here you can see the battery voltage over the time axis.
- With and you can use as a zoom. It
will be adjusted, how many seconds are symbolized
by one displayed point (s/P). PLEASE NOTE: the
voltage is automatically scaled. The given voltage
refers to the regarding visible part of the graphic
illustration (graph).
- , have no function here.
- activates the scroll function.
- is changing back to the data view display.
19
Graph with activated scroll function
Every figure of the graph can be individually displayed.
- The buttons and keep on having their
zoom function.
- With and the graph can be moved to the
left or right. During moving the graph the displayed
voltage and time corresponds to the cursor position.
- ends the scroll function.
- is changing back to the data view display.
Cursor
position
DOWN
ENTER /
START
_
MODE /
CANCEL
+
UP
DOWN
ENTER /
START
_
MODE /
CANCEL
+
UP
DOWN
ENTER /
START
_
MODE/
CANCEL
+
UP
ENTER /
START
MODE /
CANCEL
ENTER /
START
ENTER /
START
Содержание Overloader 2
Страница 1: ......
Страница 31: ...Notes 31...


