


70
EM1500 Configuration
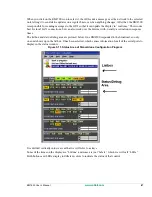
To the right of the text field, there are 4 bar graph displays arranged in a 2x2
matrix. These displays give an indication of how much the various internal
buffers are being utilized. These displays are interpreted as follows:
On the left side (the side with the arrow heads) you can imagine the serial
port. On the right side, imagine the network. [You can remember this because it is the same order as
the text field which contains the speed (serial port parameter) on the left, and IP address (network
parameter) on the right.] The arrow head shows the direction of data transfer: the top shows data com-
ing from the serial port and out to the network. The bottom shows data from the network going to the
serial port.
The bar graphs show how much of the buffer is used. The left side bars show the serial port buffers
(both of which contain a maximum of 1020 characters). The right side bars show the network buffers
(which contain approximately 4k of data).
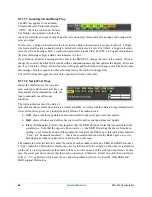
You can use these bar graphs, and the status indicators, to debug a problem with data flow. For example, if
you have set up SER2 to use hardware flow control, and the attached serial device has somehow become
unresponsive, this is what will happen:
The serial device has some sort of processing backlog, so it drops its RTS signal. The SER2 RTS LED
will go off. This prevents the EM1500 from transmitting more data out of its serial port. Thus, the
Flow LED will come on (yellow) indicating a flow control stall. If data is still coming in from the net-
work, that data will back up in the serial port transmit buffer (lower left). When this becomes full, the
network buffer (lower right) will also start backing up. When this too fills up, the network peer, that is
generating the data in the first place, will not be able to send any more data over the network. This
may cause it to exercise flow control on its serial device, but that's another story.
Hopefully, this situation will not last too long. When the first serial device eventually finishes process-
ing its backlog, it will reassert its RTS. The EM1500 will not be stalled any more, so the Flow LED
will go off. Now the serial port transmit buffer will start draining. The bar graph will diminish, but
sometimes go up again if data is staged from the network buffer to the serial transmit buffer.
At the very bottom of the GUI window, there is a text log of events. This is useful for debugging. Most of
the messages are self-explanatory. You can copy and paste from this text field into an email if required by
technical support.
Failed
Detected error in connection
wAbort
Starting to abort connection
wInit
Starting to re-initialize
wOpen
In waiting period prior to reopening
wClose
In waiting period prior to starting to close
Table 5.5 Connection state to the network
State
Meaning
Содержание EM1500
Страница 14: ...10 www rabbit com Introduction...
Страница 22: ...18 www rabbit com Getting Started...
Страница 76: ...72 www rabbit com EM1500 Configuration...
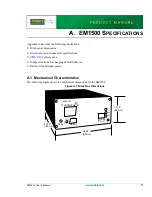
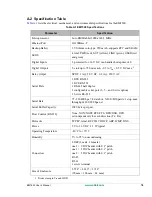
Страница 90: ...86 www rabbit com EM1500 Specifications...
Страница 104: ...100 www rabbit com Serial and TCP Protocols...
Страница 118: ...114 www rabbit com EM1500 FAQ...