
5 – Managing Ports
Displaying Port Information
5-4
59226-00 B
S
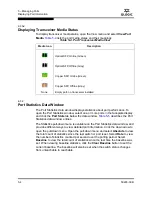
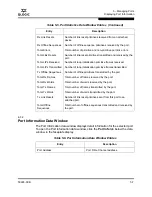
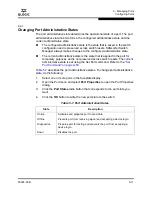
5.1.1.4
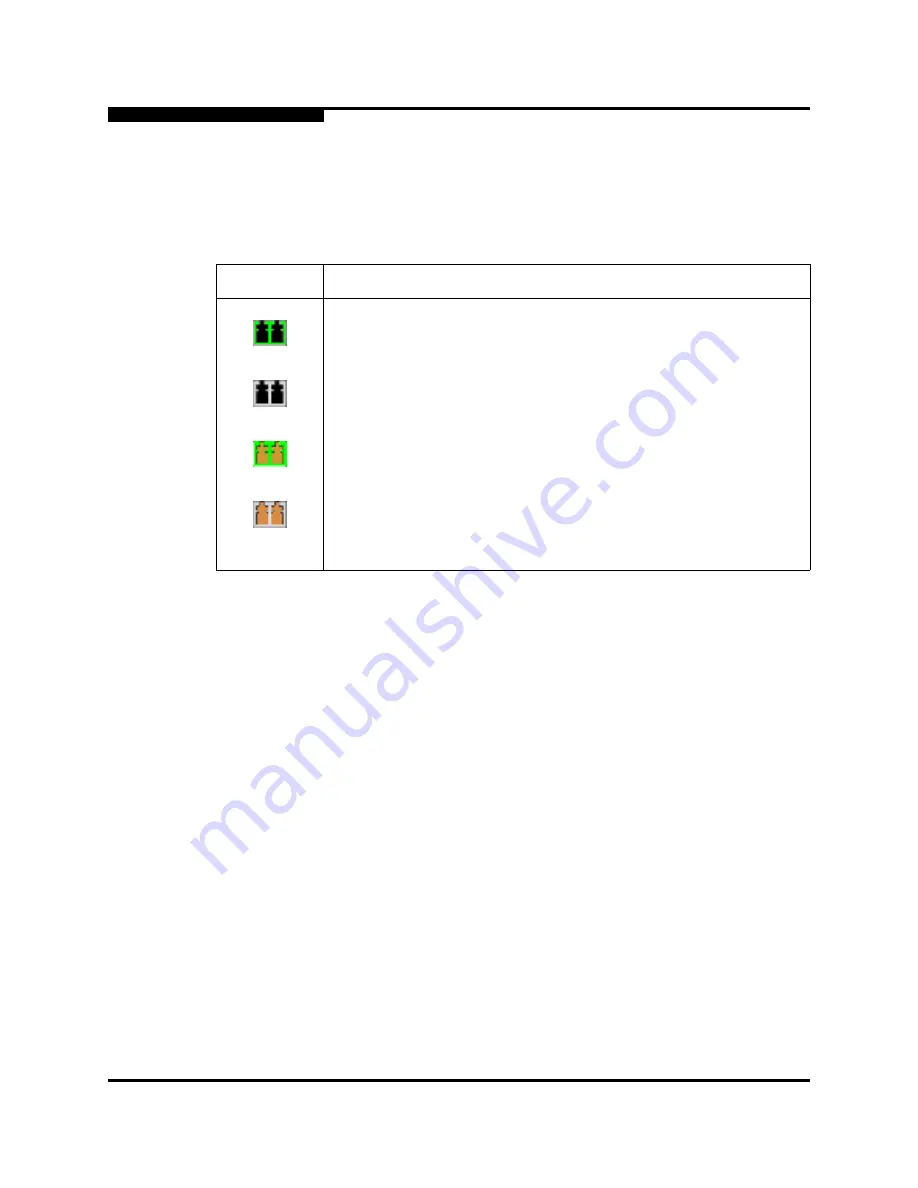
Displaying Transceiver Media Status
To display transceiver media status, open the View menu and select
View Port
Media
.
Table 5-4
lists the port media states and their meanings.
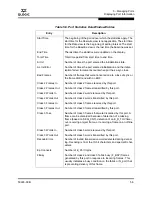
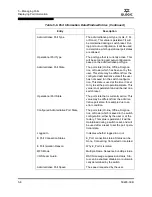
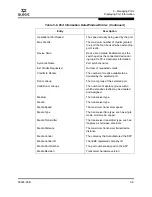
5.1.2
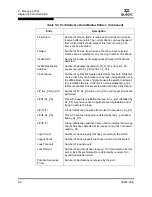
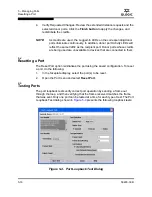
Port Statistics Data Window
The Port Statistics data window displays statistics about port performance. To
open the Port Statistics window, select one or more ports in the faceplate display
and click the
Port Stats
tab below the data window.
Table 5-5
describes the Port
Statistics data window entries.
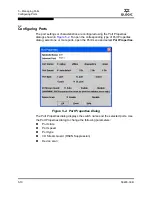
The Statistics pull-down menu is available on the Port Statistics data window, and
provides different ways to view detailed port information. Click the down arrow to
open the pull-down menu. Open the pull-down menu and select
Absolute
to view
the total count of statistics since the last switch or port reset. Select
Rate
to view
the number of statistics counted per second over the polling period. Select
Baseline
to view the total count of statistics since the last time the baseline was
set. When viewing baseline statistics, click the
Clear Baseline
button to set the
current baseline. The baseline will also be set when the switch status changes
from unreachable to reachable.
Table 5-4. Port Transceiver Media View
Media Icon
Description
Optical SFP, Online (Green)
Optical SFP, Offline (Gray)
Copper SFP, Online (Green)
Copper SFP, Offline (Gray)
None
Empty port, no transceiver installed
Содержание SANbox 1400 Series
Страница 12: ...Page xii 59226 00 B SANbox 1400 Series Switch Management User s Guide S Notes...
Страница 126: ...4 Managing Switches Displaying Hardware Status 4 38 59226 00 B S Notes...
Страница 154: ...5 Managing Ports Graphing Port Performance 5 28 59226 00 B S...
Страница 265: ...A Command Line Interface Zoning Command 59226 00 B A 111 A...
Страница 266: ...A Command Line Interface Zoning Command A 112 59226 00 B S Notes...


