
5 – Managing Ports
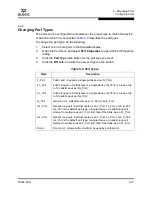
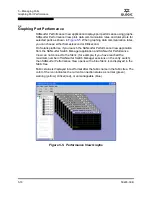
Graphing Port Performance
59226-00 B
5-23
A
5.6.6
Setting the Polling Frequency
SANsurfer Performance Viewer updates the graphs once per second by default.
To change this polling frequency, do the following:
1.
Open the Graph menu, and select
Set Polling Frequency
to open the Set
Graph Polling Frequency dialog.
2.
Enter the new polling interval in seconds [1–60]. Performance Viewer will
update the graphs once during the interval. For example, setting the polling
frequency to 5 seconds will return 1 second’s worth of data every 5 seconds.
3.
Click the
OK
button to save the changes.
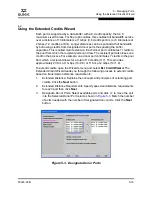
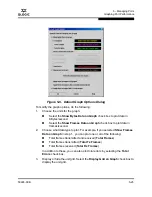
5.6.7
Displaying Graphs for a Switch
To display graphs for a switch, do the following:
1.
Open the Fabric menu and select
Add Fabric
or click the
Add
button. Enter
a fabric name and an IP address in the Add a New Fabric dialog. Include an
account name and a password if required.
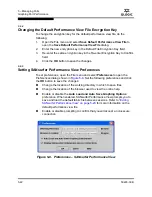
2.
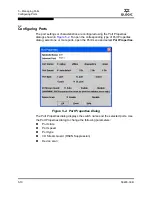
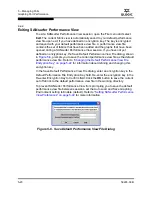
Set the graphing options and polling frequency. By default, SANsurfer
Performance View plots total bytes transmitted and received at a polling
frequency of once per second. Refer to
“Customizing Graphs” on page 5-24
for information about changing what is plotted and how it is plotted.
3.
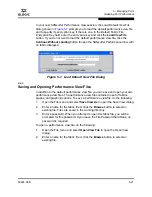
You can display graphs in the following ways:
Click on a switch entry handle and select one or more ports.
Right click on a switch icon in the fabric tree and select
Open Graph
for All Ports on Switch
or
Open Graph for All Logged-In Ports on
Switch
from the pull-down menu.
4.
You can move graphs around individually by clicking and dragging, or you
can arrange them as a group. Refer to
“Arranging Graphs in the Display” on
page 5-24
for more information.
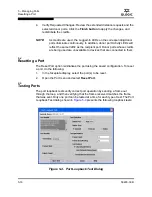
To remove a graph, click the graph
Remove
button. To remove all graphs, open
the Window menu and select
Close All
.
To remove a fabric and its graphs, select the fabric in the fabric tree, then select
Remove Fabric
from the Fabric menu. You can also right click on a fabric and
select
Remove Fabric
for the popup menu.
Right clicking on a graph opens a popup menu from which you can change graph
options, print a graph, or save the graph statistics to a file.
Содержание SANbox 1400 Series
Страница 12: ...Page xii 59226 00 B SANbox 1400 Series Switch Management User s Guide S Notes...
Страница 126: ...4 Managing Switches Displaying Hardware Status 4 38 59226 00 B S Notes...
Страница 154: ...5 Managing Ports Graphing Port Performance 5 28 59226 00 B S...
Страница 265: ...A Command Line Interface Zoning Command 59226 00 B A 111 A...
Страница 266: ...A Command Line Interface Zoning Command A 112 59226 00 B S Notes...


