


Diagnostics and Troubleshooting
MVI56-MCM
♦
ControlLogix Platform
Modbus Communication Module
ProSoft Technology, Inc.
Page 73 of 159
July 24, 2008
Port Configuration (Ports 1 and 2)
Press
[6]
or
[7]
to view the configuration information for the selected Modbus
port.
Exiting the Program
Caution: Some of the commands available to you from this menu are designed for advanced
debugging and system testing only, and can cause the module to stop communicating with the
processor or with other devices, resulting in potential data loss or other failures. Only use these
commands if you are specifically directed to do so by ProSoft Technology Technical Support staff.
Some of these command keys are not listed on the menu, but are active nevertheless. Please be
careful when pressing keys so that you do not accidentally execute an unwanted command.
Press
[Esc]
to restart the module and force all drivers to be loaded. The module
will use the configuration stored in the module's Flash ROM to configure the
module.
7.1.6 Data
Analyzer
The data analyzer mode allows you to view all bytes of data transferred on each
port. Both the transmitted and received data bytes are displayed. Use of this
feature is limited without a thorough understanding of the protocol.
Note: The Port selection commands on the Data Analyzer menu differs very slightly in different
modules, but the functionality is basically the same. Use the illustration above as a general guide
only. Refer to the actual data analyzer menu on your module for the specific port commands to
use.
Important: When in analyzer mode, program execution will slow down. Only use this tool during a
troubleshooting session. Before disconnecting from the Config/Debug port, please press [S] to stop
the data analyzer, and then press [M] to return to the main menu. This action will allow the module
to resume its normal high speed operating mode.
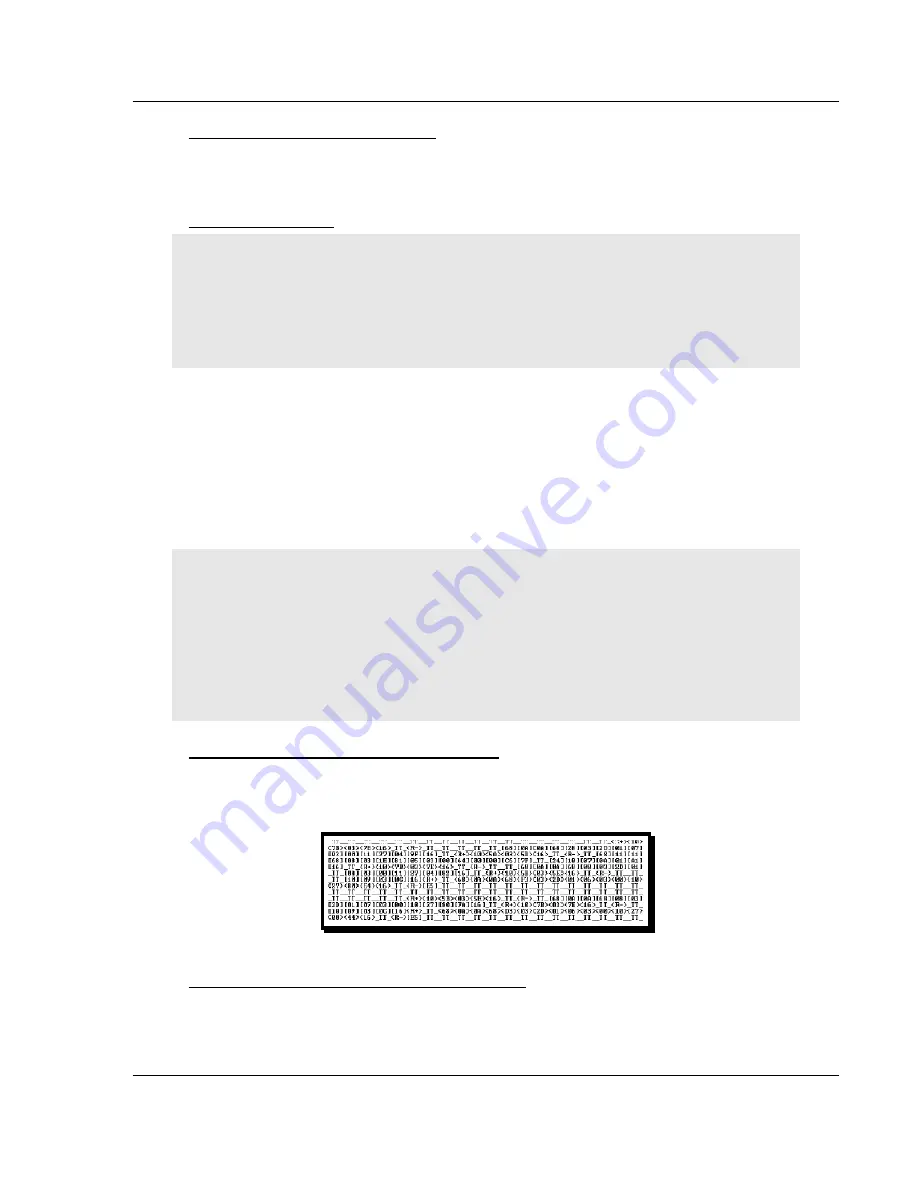
Analyzing Data for the first application port
Press
[1]
to display I/O data for the first application port in the Data Analyzer.
The following illustration shows an example of the Data Analyzer output.
Analyzing Data for the second application port
Press
[2]
to display I/O data for the second application port in the Data Analyzer.


