18
© 2014 Proceq SA
To change from SX- to SY-scanning tap on
,vice versa tap on
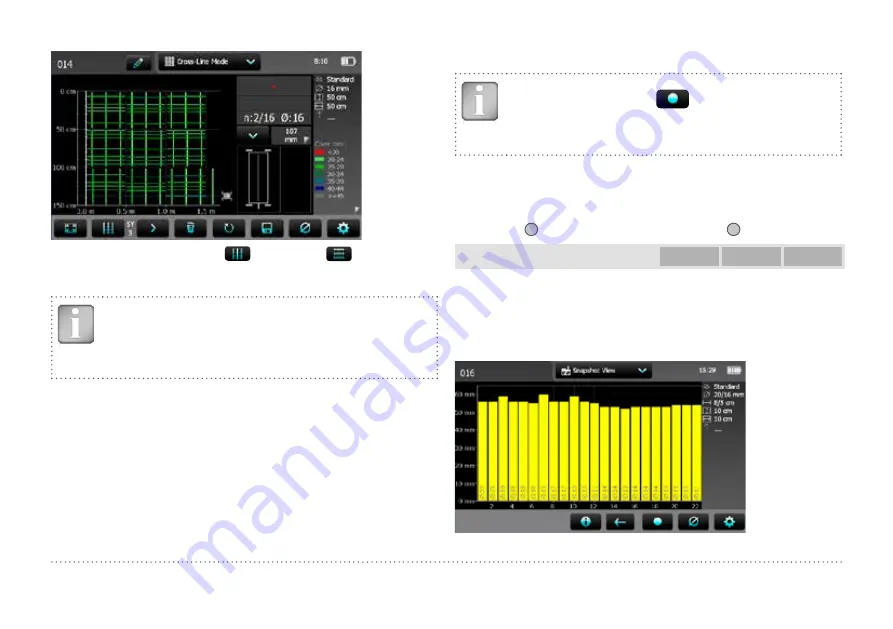
Figure 13:
Screen of Cross-Line Mode
NOTE! By changing the setting “Line Height” or Grid
Width”during the measurements the height or width of all
lines including the ones already measured will change and
hence, also the line positions. Change the line height or
width only if it was previously wrongly set.
To show the rebars of the first layer above the ones of the second layer,
scan first the second layer in X-direction.
Alternatively the diameter or the cover of the rebars can be displayed like
for the Multi-Line Mode, thus for rebars running in X- and Y direction.
In the Cross-Line View the signal strength spectrum can be seen in ad-
dition to the cover and diameter, thus for both (SX- and SY) scanning
directions, see ”3.6 Review of Data”.
In the Snapshot View the data are shown in a chronological sequence
from left to right. Therefore in the Cross-Line Mode you should collect the
complete data of one layer prior to change the scanning direction from
SX to SY or vice versa.
3.6 Review of Data
NOTE! Each View can be changed in a measuring mode in
order to add data. Tap on
. Set the cursor to the new
starting position and continue with the measurements (see
“3.5 Measurement Modes and Storage of Data”). All data will
be stored in the reopened file.
Measured data can be displayed in six different views: Snapshot,
Statistics, Single-Line, Multi-Line, Area-Scan and Cross-Line View. All
the settings stored with the measurements can be changed afterwards.
The views will change accordingly. To store the measuring series with the
changes tap
7
. To return to the initial settings tap
8
.
Snapshot View
PM-600
PM-630
PM-650
The Snapshot View can be displayed if at least one diameter was meas-
ured and stored in one of the measurement Modes.
The cover values are shown as vertical bars to scale and the diameter as
a figure, both in the unit set. The Minimum Cover is not displayed in the
Snapshot View.
Figure 14:
Snapshot View


