


Monitoring the Unit
4-10
7976-A2-GB20-10
August 1998
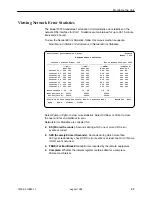
Viewing G.703 Performance Statistics
G.703 performance statistics allow you to monitor the current status of the G.703
interface operations. Performance statistics can assist you in determining the
duration of specific conditions and provide a historical context for problem
detection and analysis. Statistics are maintained for up to 96 15-minute intervals
(24 hours).
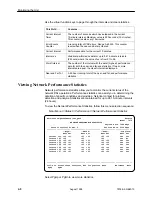
To view the Network Performance Statistics, follow this menu selection sequence:
Main Menu
→
Status
→
Performance
→
G.703 Performance Statistics
ÎÎÎÎÎÎÎÎÎÎÎÎÎÎÎÎÎÎÎÎÎÎÎÎÎ
ÎÎÎÎÎÎÎÎÎÎÎÎÎÎÎÎÎÎÎÎÎÎÎÎÎ
ÎÎÎÎÎÎÎÎÎÎÎÎÎÎÎÎÎÎÎÎÎÎÎÎÎ
ÎÎÎÎÎÎÎÎÎÎÎÎÎÎÎÎÎÎÎÎÎÎÎÎÎ
ÎÎÎÎÎÎÎÎÎÎÎÎÎÎÎÎÎÎÎÎÎÎÎÎÎ
ÎÎÎÎÎÎÎÎÎÎÎÎÎÎÎÎÎÎÎÎÎÎÎÎÎ
ÎÎÎÎÎÎÎÎÎÎÎÎÎÎÎÎÎÎÎÎÎÎÎÎÎ
ÎÎÎÎÎÎÎÎÎÎÎÎÎÎÎÎÎÎÎÎÎÎÎÎÎ
ÎÎÎÎÎÎÎÎÎÎÎÎÎÎÎÎÎÎÎÎÎÎÎÎÎ
ÎÎÎÎÎÎÎÎÎÎÎÎÎÎÎÎÎÎÎÎÎÎÎÎÎ
ÎÎÎÎÎÎÎÎÎÎÎÎÎÎÎÎÎÎÎÎÎÎÎÎÎ
ÎÎÎÎÎÎÎÎÎÎÎÎÎÎÎÎÎÎÎÎÎÎÎÎÎ
ÎÎÎÎÎÎÎÎÎÎÎÎÎÎÎÎÎÎÎÎÎÎÎÎÎ
ÎÎÎÎÎÎÎÎÎÎÎÎÎÎÎÎÎÎÎÎÎÎÎÎÎ
ÎÎÎÎÎÎÎÎÎÎÎÎÎÎÎÎÎÎÎÎÎÎÎÎÎ
main/status/performance/G.703 Hotwire
Model: 7976
G.703 PERFORMANCE STATISTICS
Current Interval Timer: 2 Error Events Counter: 0000
–––––––––––––––––––––––––––––––––––––––––––––––––––––––––––––––––––––––––––––––
––ES––
––UAS––
––SES––
––BES–– ––LOF––
–Status–
Current Int:
000
000
000
000
000
Y
Interval 01
000
000
000
000
000
none
Interval 02
000
000
000
000
000
none
Interval 03
000
000
000
000
000
none
Interval 04
000
000
000
000
000
none
Interval 05
000
000
000
000
000
none
Interval 06
000
000
000
000
000
none
Interval 07
000
000
000
000
000
none
Worst Interval: 24
14
14
09
18
Tot (valid 96):00010
00000
00000
00000
002
–––––––––––––––––––––––––––––––––––––––––––––––––––––––––––––––––––––––––––––––
Ctrl–a to access these functions, ESC for previous menu MainMenu Exit
PgUp PgDn ClrStats
Select PgUp or PgDn to view the next or previous seven intervals, select ClrStats
to clear all statistics to zero.
G.703 Performance Statistics are collected for:
H
ES (Errored Seconds): Seconds during which one or more error events
occurred.
H
UAS (Unavailable Seconds): Seconds during which service is unavailable.
UAS is received at the start of 10 consecutive SES and cleared at the start of
10 seconds with no SES.
H
SES (Severely Errored Seconds): Seconds during which more than
805 cyclic redundancy check (CRC) error events, more than 16 FAS errors,
or at least one Out of Frame (OOF) event occurred.
H
BES (Bursty Errored Seconds): Contains the number of bursty errored
seconds for the current interval. A bursty errored second is any second with
more than one but less than 805 CRC errors (CRC Mode) or more than one
but less than 16 FAS errors (non-CRC mode).
H
LOF (Loss of Frame Seconds): Contains the number of seconds that
contain one or more LOF events.
Содержание Hotwire 7976
Страница 42: ...Initial Startup and Configuration 3 18 7976 A2 GB20 10 August 1998 This page intentionally left blank...
Страница 56: ...Monitoring the Unit 4 14 7976 A2 GB20 10 August 1998 This page intentionally left blank...
Страница 66: ...Testing 5 10 7976 A2 GB20 10 August 1998 This page intentionally left blank...
Страница 78: ...Security 7 6 7976 A2 GB20 10 August 1998 This page intentionally left blank...
Страница 104: ...Standards Compliance for SNMP Traps B 6 7976 A2 GB20 10 August 1998...
Страница 112: ...Technical Specifications D 2 7976 A2 GB20 10 August 1998...