


17 |
P a g e
Setting up the Chart
The first time the chart is loaded it is blank. To start graphing, first use the toolbar in the
upper left of the chart to select which end devices to view. Next select which sensor type to
view. The chart will now start to display the data. Up to two different sensor types can be
selected. The first is plotted on the left axis and the second is plotted on the right axis.
As End Devices are added to the chart they also appear in the key above the chart. Each
measurement in the chart is displayed in a different color. The key displays the color followed
by the End Device ID, the sensor number and the units of measure for each measurement.
The sensor number is used to distinguish between sensors for units equipped with more than
one sensor of the same type such as dual thermocouple inputs.
Manipulating The Chart
All chart axes are fully user customizable. By
default, the cart will show one hour of data
and scale each axis to fit the sensor
readings received. The scale on each axis
can be fixed to user defined extents and the
amount of time shown can also be
customized.
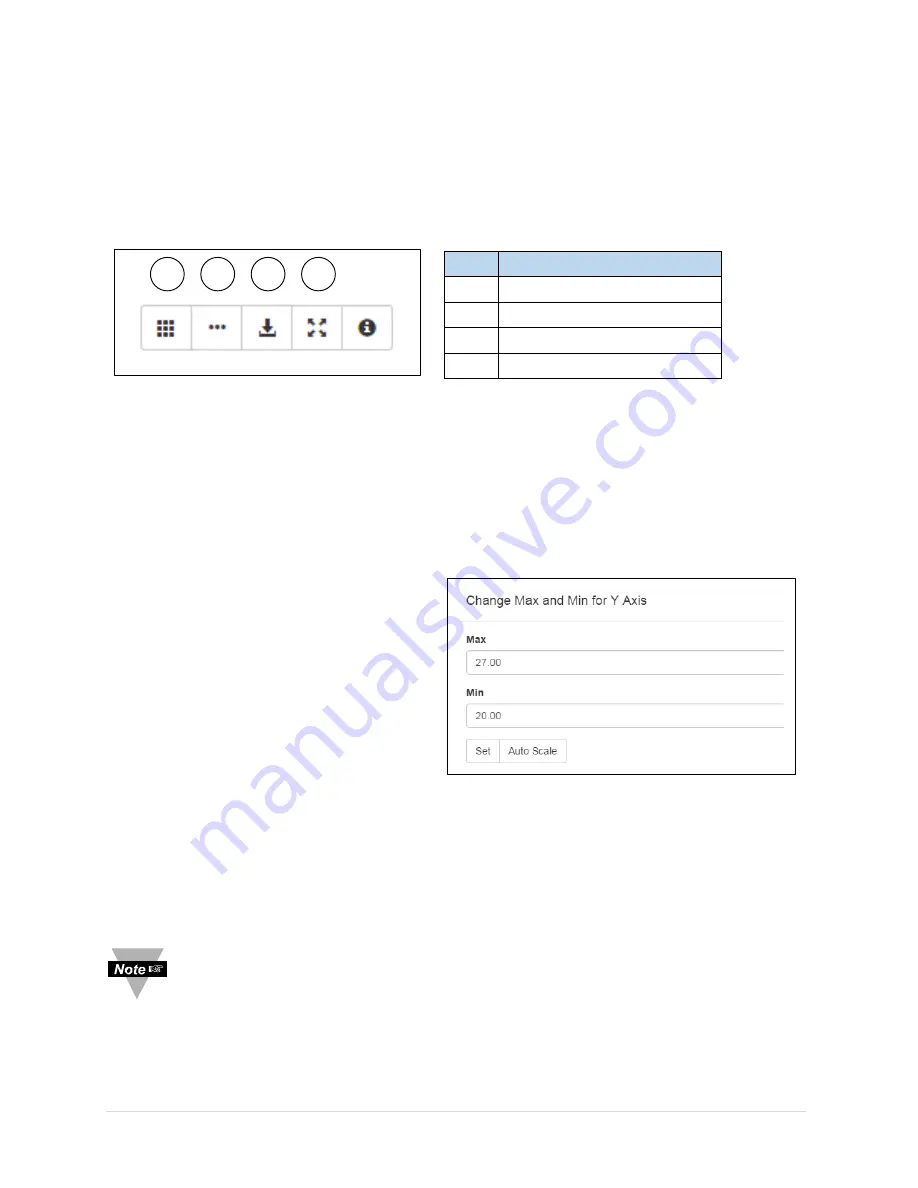
To change the scale of a vertical axis, click
on the axis title, enter the desired
Maximum and Minimum for the axis and
press the
Set
button to change the scale.
Use the
Auto Scale
button to have the chart
scale to fit the data.
To change the horizontal axis, enter the desired chart time, in minutes, into the time span box
at the bottom of the chart. This indicated how much time the chart will cover. The chart
always displays the most recent data. The frequency the chart is updated can also be
changed. Enter the desired frequency in the update time box.
Note:
The update time for the chart is unrelated to the update time for End
Devices. If the chart updates more often than the End Device, it will display the
same data point multiple times.
Item Name
1
Select End Devices
2
Select Sensor Types
3
Save Graph Data
4
Reset Zoom
2
1
3
4
Figure 11. Chart Toolbar
Figure 12. Chart Axis Dialog


