NRG USER MANUAL
SymphoniePLUS3 User Guide
SymphoniePLUS3_DataLogger_Manual
Rev. 17
[email protected] | Page 94
31 December 2018
Reading Data in the Data Viewer
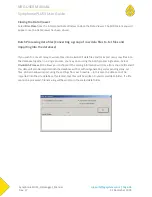
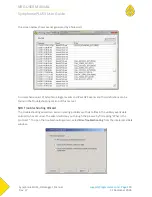
With the data file open, you may now “Read” the data in the graphical data viewer.
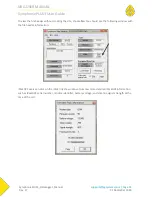
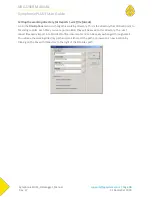
Scaling from Logger settings
If you wish to use the settings that are included in the data file (the settings that were programmed into
the logger), select “Scale using settings from: Logger.” When the “Read Data” button is clicked, the
resulting data viewer window will be based on the logger settings.
Scaling from Site settings
If you wish to use the settings that are saved to the site file on your computer, select “Scale using
settings from: Site.” Now the data viewer window will be based on the site information as it was
configured with the SDR software.
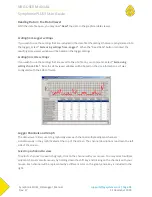
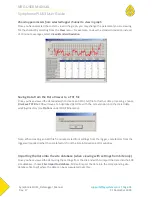
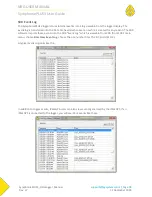
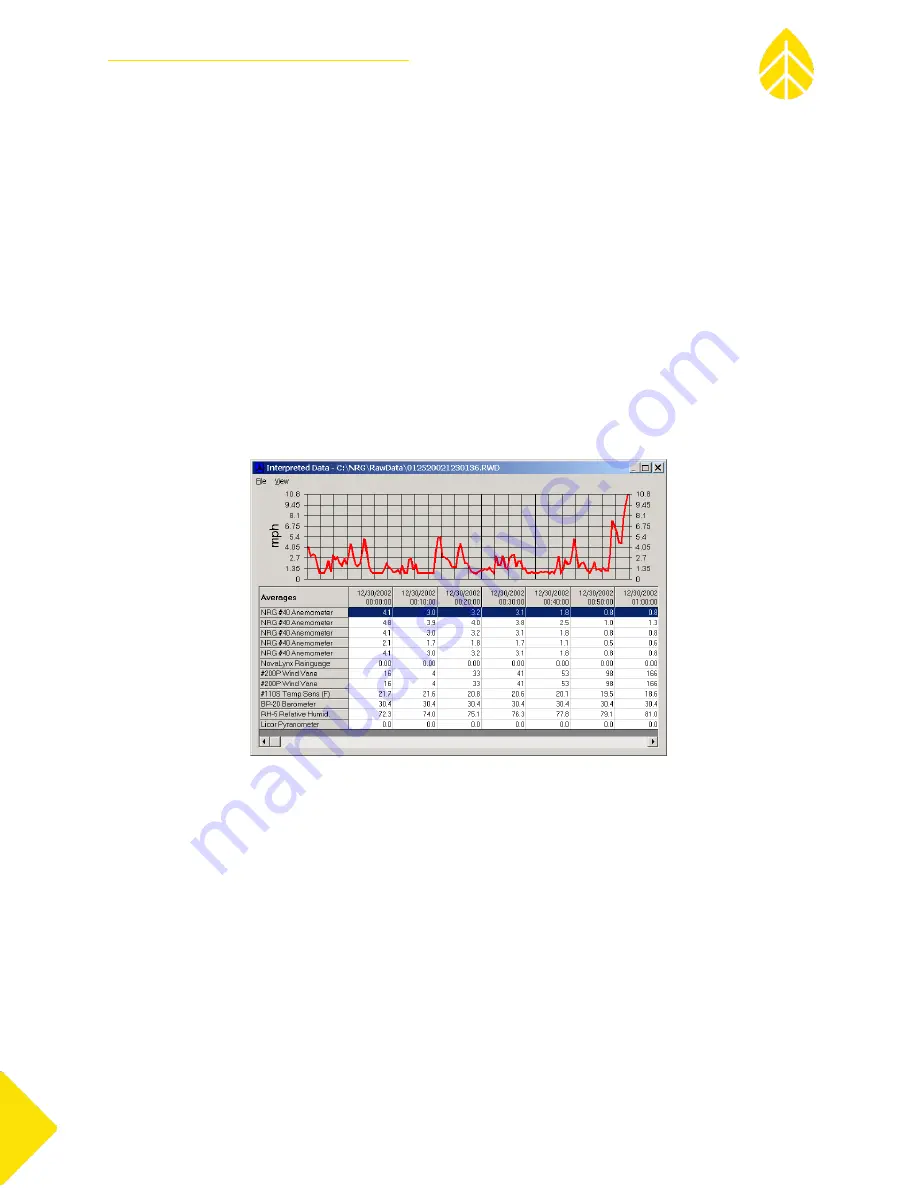
Logger Channels and Graph
The data viewer allows users to graphically view each channel multiple adjacent channels
simultaneously in the graph located at the top of the screen. The channel descriptions run down the left
side of the screen.
Selecting a channel to view
To select a channel to view in the graph, click on the channel with your mouse. You may select multiple
adjacent channels simultaneously by holding down the shift key and clicking on the channels with your
mouse. Each channel will be represented by a different color on the graph, and a key is included to the
right.


