4.
Alignment and Measurement
"TCP Autoconnect" Checkbox:
Check this box for an automatic server initialization at program
start up.
"Exit":
Closes the Control Software.
4.3.2.
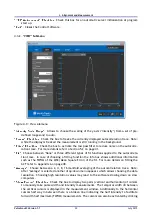
"VIEW" Submenu
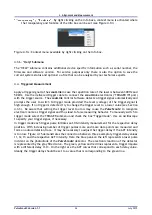
Figure 4.9.: View submenu
"Intensity Scale Range":
Allows to choose the scaling of the y-axis ("Intensity") from a set of pre-
de ned ranges and to auto.
"Freeze" Checkbox:
Check the box to freeze the currently displayed autocorrelation trace. Note:
while the display is freezed the measurement is still running in the background.
"Filter" Checkbox:
Check the box to activate the low pass lter to reduce noise on the autocorre-
lation trace. For more details refer to Section 5.2 on page 41.
"Fit":
Choose between "None" or three different types of t functions applied to the autocorrela-
tion trace. In case of choosing a tting function the Info box shows additional information
such as the FWHM of the MSE (Mean Square Error) of the t. For more details on tting the
ACF refer to Appendix A on page 48.
"Average":
Choose between a 2, 4, 8, 16 manifold averaging of the autocorrelation trace. Note:
After "Average" is selected another drop-down menu appears which allows choosing the data
resolution. Choosing high resolution values may lead to the software slowing down on slow
computers.
"Show Cursors" Checkbox:
Check the box to display two pairs (vertical and horizontal) of cursors
to manually take pulse width and intensity measurements. The temporal width of/between
the vertical cursors is displayed in the measurement window. Additionally to the horizontal
cursors half way in between there is a broken line indicating the half intensity to facilitate
full width half maximum (FWHM) measurements. The cursors can also be activated by clicking
Pulse
Scout2 Version 1.1
30
July 2015


