4.
Alignment and Measurement
4.2.2.
Finding the Autocorrelation Trace
With the
scout
Link
turned on and the software connected press the "Start" button in the Control
Software. A at horizontal line over the whole screen should be displayed. It represents the
signal detected by the detector module. If no signal is present the at line is comprised only of
background noise.
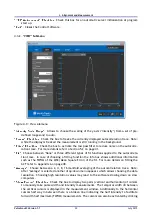
It is recommended to set the highest scan range ("SETUP"
→
Scan Range) to make sure to see even
temporarily offset signals. Next, gradually increase "Sensitivity" ("SETUP"
→
Sensitivity) until either
a clear signal or noise is observed. If the autocorrelator is responding to room or ambient light
(this is especially true for devices with photomultiplier [PMT] detectors), dim the lights or block off
the source of external light from the autocorrelator. Rotate the crystal using the "Tuning" arrows
("SETUP"
→
Tuning) to nd the optimal phase-matching angle (refer to Section 4.2.3 on page 26 for
more details on tuning and phase-matching). Note that the actual angular value of the crystal is
shown between the tuning arrows in arbitrary units. If the maximum or minimum limit of the angle
is reached such that the number displayed is no longer changing, reverse the tuning direction and
turn the crystal to the opposite end in order to nd the ACF signal. An optimal phase-matching is
characterized by a clear, angle dependent signal maximum as depicted in Figure 4.6 on page 26.
At this point it is important to note that many laser sources (such as OPOs) may have a small portion
of second harmonic light coincident with the fundamental laser pulse aligned to the
Pulse
Scout2
,
and this small amount of light may overlay the, in comparison weaker, second harmonic signal that
is generated by the crystal inside the autocorrelator. To avoid this introduce a long pass lter into
the laser beam such that the fundamental wavelength is transmitted and wavelengths close to the
second harmonic are blocked.
If the autocorrelation signal extends beyond the intensity scale off the measurement screen ("Over-
load" appears on the screen), decrease "Sensitivity" and/or decrease the laser input power. Be
aware that using neutral density (ND) lters to decrease laser power also temporally broadens the
laser pulses (by dispersion) and thus may alter the measurement. The pulse broadening depends
on the ND substrate material, the wavelength and the pulse width itself. Therefore a good practice
is to take the refection of a glass plate to reduce laser power without broadening the laser pulse.
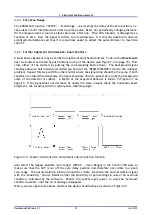
Figure 4.5.: Example of a good autocorrelation function (ACF) in the collinear mode (left) and
non-collinear mode (right)
To check the autocorrelation signal, block one of the beams of the Michelson interferometer inside
the autocorrelator by pushing the shutter knobs S1 and S2 on top of the
Pulse
Scout2
(see Figure
3.3 on page 18). Blocking either beam individually will eliminate the signal originating from the
interaction of the two beams (ACF) by half (collinear setting).
Finally optimize the peak and the peak-to-background ratio of the autocorrelation signal through
adjustment of the crystal angle (see Section 4.2.3 on page 26 Crystal Angle Tuning and Phase-
Pulse
Scout2 Version 1.1
25
July 2015


