background image


Page 

58

 of 

76


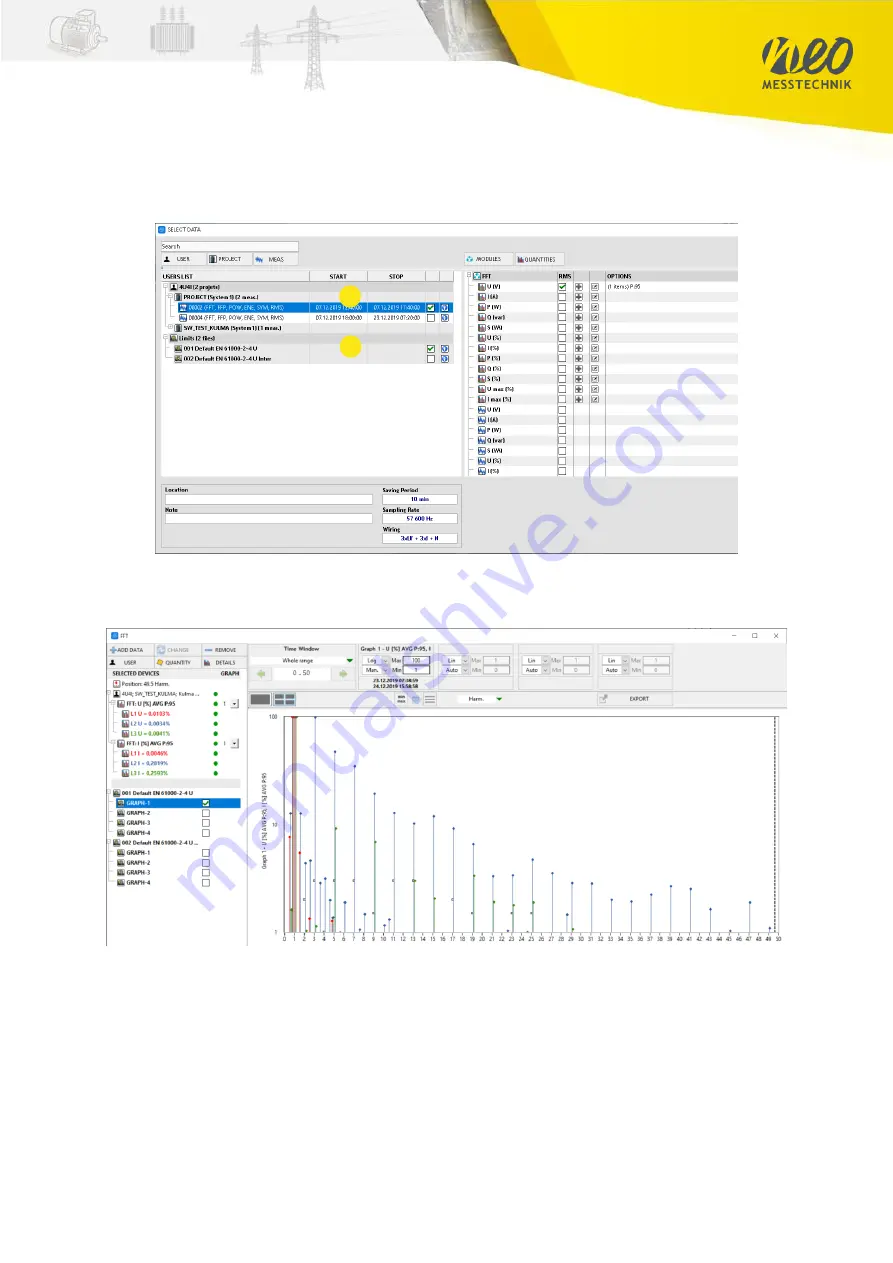
FFT Reference Curve  

Application: Evaluation according to IEC61000-2-2, -3-3, IEEE519, etc. 

For 

Harmonic FFT analysis it’s possible to add a reference curve to the visualization screen. 

When selecting the quantities (1), you can add the desired reference curve at “Limits” (2). 


The limits are shown as circles in the visualization: 


For different graphs, different limits can be selected. 

The parameters can 

be shown in different quantiles (95%, 99%, 100% … definable) at the 

same time. 

Key Feature:

 IEEE519 requires different quantile calculations 


Содержание PQA8000

Страница 1: ...Page 1 of 76 USER MANUAL V1 9 www neo messtechnik com NEO Messtechnik GmbH Sonnweg 4 A 2871 Z bern Austria 43 2642 20 301 NEO Messtechnik GmbH All rights reserved...

Страница 2: ...protected by copyright Reproduction adaptation or translation without prior written permission is prohibited except as allowed under the copyright laws All trademarks and registered trademarks are ack...

Страница 3: ...3 3 1 Voltage Inputs 13 3 3 2 Current Inputs 13 3 3 3 Additional Low Voltage Signal Input 15 3 3 4 Digital Input Output 16 3 3 5 Communication Ports 16 3 3 6 Computer Interface 17 3 3 7 Antenna and Ba...

Страница 4: ...sturbance Recorder 40 4 5 8 Phase Measure Unit 47 4 5 9 Display of actual values 50 4 6 Data Analysis 51 4 6 1 Settings 52 4 6 2 Graphs Time Series Data 53 4 6 3 FFT Data 57 4 6 4 Events Alarms Transi...

Страница 5: ...ination with the internal battery pack the PQA8000 operates up to 3 hours without any external power source The PQA8000 offers multi device synchronization due to a highly accurate GPS clock available...

Страница 6: ...igh capacity SSD 2 x 256GB max Sunlight readable multi touch screen LCD and HDMI port for external monitor Small and light case with rubber protection Versatile Power Quality software including analyz...

Страница 7: ...gases fumes or dust or in adverse environmental conditions The use of the measuring system in schools and other training facilities must be observed by skilled personnel Please contact a professional...

Страница 8: ...witch In addition provide a name for the workplace location and supervisor The power off device should be locked to a mechanical device All keys must be kept in a safe place If it is operated with the...

Страница 9: ...ttery self discharges during storage Higher temperatures above 20 C or 68 F reduce the battery storage life If you start instrument after over discharge or you didn t use it for a long time the instru...

Страница 10: ...compliant with the CE requirements EMC Directive 2014 30 EU Test Procedure EN 55011 2009 A1 2010 Group 1 Class A EN 61326 1 2013 EN 61000 3 2 2014 EN 61000 3 3 2013 EMI EN55011 Conducted Emission CE R...

Страница 11: ...plastic LEMO connectors for Current Inputs on the top plate Furthermore one DSUB15 connector for low voltage signal measurement one DSUB9 connector for RS 485 communication and another DSUB9 connecto...

Страница 12: ...r voltage measurement are on the left 6 LEMO connectors for current measurement sensors are on the right side DSUB15 for additional low voltage analog signal input DSUB9 for RS 485 CAN2 0 and DIO are...

Страница 13: ...g on the hardware the channels are assigned to different Analog Input AI channels 3 3 2 Current Inputs For current measurement via sensors 6 LEMO connectors are placed on the right top side of the dev...

Страница 14: ...g the following pin assignment Depending on the hardware the channels are assigned to different AI channels Pin Signal PQA8000H 1 Signal Signal 2 Signal Signal GND 3 FGND FGND 4 NC Rogowski 5 TEDS TED...

Страница 15: ...t measurement So you just should either use the 6th current input or AI 2 of the DSUB 15 connector This connector is often used for connection of additional signals like pyranometer weather sensor tem...

Страница 16: ...e fully synchronized to the analoge input data voltage current additional AI It offers 12VDC for power supply if needed Pin Signal Description 1 DO0 Isolated digital output 0 2 DO1 Isolated digital ou...

Страница 17: ...eld 3 TMDS data 2 4 TMDS data 1 5 TMDS data1 shield 6 TMDS data 1 7 TMDS data 0 8 TMDS data0 shield 9 TMDS data 0 10 TMDS clock 11 TMDS clock shield 12 TMDS clock 13 CEC 14 NC 15 DDC clock 16 DDC data...

Страница 18: ...on modem antenna option can be installed inside Battery indicator LED 3 3 8 Fan Three Fans for internal heat control are located on the right side Two fans input the cold air while the third outputs t...

Страница 19: ...Page 19 of 76 3 4 Status LED The status LED is located on the upper right side of the upper plate LED Status Description Green Standby for measurement Green blinking Measuring and storing...

Страница 20: ...he instrument version the 3U3I 1U1I config PQA8000 or the 3U3I 3U3I config PQA8000M PQA8000P will be applied In the software you can switch between the systems with this button The button is either lo...

Страница 21: ...tage and 4x Current measurement 3U3I 1U1I Configuration for two different power systems Example 1 1x 3 Phase AC and 1x DC Example 2 1x 3 Phase AC 50Hz and 1x 1 Phase AC 16 7Hz 3U3I 3U3I Configuration...

Страница 22: ...l The Summary panel shows the current setup values of the device and is the easiest way to configure the instrument for your application It summarizes all configurations for Wiring Frequency Limits Us...

Страница 23: ...a fundamental frequency 1 After selecting the fundamental frequency click the Apply button 2 4 2 2 Basic Wiring Setup To select a wiring type click Wiring button in Summary panel 1 Alternative Navigat...

Страница 24: ...se parameters the measurement is restarted If data is currently stored the change of these settings is disabled The System selection allows to setup these setting to actual system only or to all syste...

Страница 25: ...Page 25 of 76 STAR Y Connection Select 3xUph 3xl in the wiring setup and connect the cables according to the picture below 1...

Страница 26: ...Page 26 of 76 STAR Y N PE Connection Select 3xUph 3xl N in the wiring setup and connect the cables according to the picture below 1...

Страница 27: ...Page 27 of 76 Delta Connection Select 3xUline 3xl in the wiring setup and connect the cables like below picture 1...

Страница 28: ...Page 28 of 76 Single Phase Connection Select 1xUph 1xl in the wiring setup and connect the cables like below picture 1...

Страница 29: ...choose to create multiple profiles with different settings USER and PROJECT can be used for differencing the data storage For every user project the measured data are stored into different folders 1 2...

Страница 30: ...ging interval Power Quality will be calculated each 10 minutes according to international standards Digital Inputs will be stored at each change of state 1 Enabled disabled button 2 Name of measuremen...

Страница 31: ...ulti system instruments Click Apply button to apply changes to instrument or Revert button to revert changes 8 To stop storing just Disable storing 1 and Apply changes 8 Storing Options Harmonic U I H...

Страница 32: ...Page 32 of 76...

Страница 33: ...ame of measurement 3 Place 4 Description 5 Begin End Type of storing 6 Begin and End time for storing 7 System selection actual system or all systems 8 Apply and Revert buttons How to setup storing In...

Страница 34: ...kHz Supraharmonics in 2kHz bands up to 68kHz 1 2 3 4 1 Displayed values voltage current active power reactive power or apparent power 2 Buttons for zoom or unzoom in the graph and for move through all...

Страница 35: ...m This options will always show from Min to Max value if this option is enabled other zoom options will be disabled 4 5 3 Vector Scope Navigation Vectors The Vectors panel displays actual 3 phase vect...

Страница 36: ...lows showing a wide range of measured parameters instant values in different table sets or customized tables with selected quantities Displayed values can be selected either from basic quantities volt...

Страница 37: ...utton to cancel 4 5 5 Multi Chart Navigation Advanced Multichart Multi Chart panel allows showing up to 4 different charts In Measurement mode the time interval can be set up to 1 hour For further and...

Страница 38: ...id voltage changes statistics EN50160 events itself are displayed in the events list panel 1 Selection of view type complex events distribution RVC Events and RVC statistics 2 Select Flagged Not Flagg...

Страница 39: ...39 of 76 1 1 Table with count of rapid voltage changes distributed by length and level 1 1 Table with rapid voltage changes statistics 1 Table with count of voltage events distributed by length and l...

Страница 40: ...Period record and Raw Data record at limit violation The Events definition panel allows to define various trigger conditions The main screen of this panel displays a list of different event types Eve...

Страница 41: ...uption Limit and the hysteresis can be defined For Rapid voltage changes the steady state rate of change min steady state difference and duration can be define Alarms Navigation Events Definition Alar...

Страница 42: ...onic crosses defined limits and can be logged if storing of alarms is enabled Alarms can be configured for different voltage harmonics 2nd to 25th The evaluation time for all of them is 10 minutes See...

Страница 43: ...of this event allows the setup of specific parameters of the signaling voltage like signal frequency start pattern and length 1 4 3 2 1 Signaling frequency 2 Start pattern length of logical 1 and logi...

Страница 44: ...different quantities and the logical coupling between them logical OR or AND can be selected If the value changes the transient event is generated edge trigger and transients of voltage and current a...

Страница 45: ...THD etc 200ms values 10 12 period values P Q S PF phi 200ms values 10 12 period values Frequency 1 period value Delta Frequency Delta between period values MAX U I Waveform Sampled values Delta Delta...

Страница 46: ...Disturbances can be defined in Misc setup panel Menu Setup Misc Disturbances 4 5 7 2 Event Table Navigation Events List This panel shows a list of already captured events It displays up to the last 10...

Страница 47: ...For PMU application a central software is needed which receives the data streams of the instrument For PMU measurements at least two PMU s needs to be installed For more details about principle and f...

Страница 48: ...tity is being provided for each channel e g raw phasor or positive negative zero component Phasor name user can edit quantity name Limits low and high exceeding the limit is included as an information...

Страница 49: ...712 but for network related reasons might be changed to another PMU station supposed to be unique name of the device this is one of the human readable parameters you can get when connected to PMU data...

Страница 50: ...es info bar shows actual value of phase voltages or currents or active reactive and apparent power Switching between displayed values is done by clicking on actual values info area By clicking on the...

Страница 51: ...Report new tool is the latest version of a reporting tool that will cover additional functionalities compared to the Report tool New power quality parameters like Supraharmonics will only be available...

Страница 52: ...tions functions Another feature is the possibility to overlay data of different measurements The user interface is now aligned to the User Interface of the PQM SCADA solution 4 6 1 Settings In Setting...

Страница 53: ...ure the Channel selection menu will appear Then select the System 2 and project 3 The treeview will enhance and show the different measurements Select the measurement 4 on the left side and check the...

Страница 54: ...tion Time Interval Data Visualization 4 If you want to add additional channels just press Add again and select the quantities you want to add Key Feature You can also add data of multiple data files r...

Страница 55: ...is activated Keep the left mouse button pressed and move over the selected area you want to zoom The data automatically will be reloaded for the selected time frame To Zoom Out press 3 The last Zoom s...

Страница 56: ...zation 1 Up to four independent charts can be defined There are three different options available Single chart Multiple charts among each other Multiple charts 2 Charts in one row see picture After se...

Страница 57: ...thmic Auto manual 3 X Axis in Harmonic orders or in Hertz Hz 4 Showing Min Max Values 5 Horizontal lines 6 Time Frame for additional FFT calculation The picture above shows visualization of Harmonics...

Страница 58: ...he visualization screen When selecting the quantities 1 you can add the desired reference curve at Limits 2 The limits are shown as circles in the visualization For different graphs different limits c...

Страница 59: ...e Min and Max Values can be shown in addtion They will appear as colored rectangles Recorder FFT By pressing Add data and selection of time series data you can add a recorder window to the FFT data Ke...

Страница 60: ...all Events The list with all events is shown The list can be ordered by date time event type unit and phase 5 Links in the menu can also be selected de selected for the event type 6 For transients the...

Страница 61: ...me selection 2 Axis 3 Multi Chart 4 In addition other parameters can be taken into account like derivate of voltage or current or frequency etc This is possible via Add 5 and selection of parameters a...

Страница 62: ...160 IEC61000 2 2 IEC61000 2 4 IEEE519 FoL standards Other templates can be added by oneself or by NEO Messtechnik 2 Select time intervall Note Multiple data files can be analysed together 3 Analysis a...

Страница 63: ...trema of voltage events the different events will be counted Voltage Harmonics The following FFT chart shows 95 quantil max and limit value of the voltage harmonics Event list All events are listed wi...

Страница 64: ...C curve The ITIC curve is an additional visualization to show and classify events The events will be shown in different colors as points depending on phase Points outside the ITIC area can affect elec...

Страница 65: ...or Events Raw Data for Transients 3 Select data file 4 Select transient respective parameters to export and time range Option 2 Export in visualization chart FFT Event Note this option will only expo...

Страница 66: ...a report After opening report function via click on PDF the report generator screen will appear 1 Select one or more data files 2 Select one templates 3 Define time frame 4 Press Export PDF Afterward...

Страница 67: ...w template via Add you can define a name for the template in the popup window The idea of creating templates follows a modular block system 1 First add a new block by pressing 2 Select one of the visu...

Страница 68: ...d press confirm 7 3 Add new block 1 and select Graph XT 4 Select Voltage Urms 5 Select page style legend off on and line style 6 Phase selection 7 Confirm 8 Save Repeat the whole procedure and select...

Страница 69: ...path of the installation folder If you use another directory you need to adjust the data path 3 in the settings of report tool see screenshot Option 2 Remote data transfer via Measure mode For this op...

Страница 70: ...data of all sensors For all current sensors detailed technical information are found as well as accuracy specifications for different applications and use cases Measurement Software Manual Detailed in...

Страница 71: ...Input 1 2 5 10 Gain Linearity 20ppm MAX Gain Drift Range 20ppm K MAX Offset Drift 6mV K MAX 26uV K MAX Input Resistance 10Mohm 10Mohm ADC Type SAR Data rate 1Msps MAX Filter Bandwidth 3dB BW Analog 51...

Страница 72: ...ent Clamp 10Vp MAX Rogowski 2Vp MAX Analog Input 10Vp MAX DC Accuracy 0 05 FS 0 05 FS Gain Voltage 1 Current Clamp 1 2 5 10 Rogowski 1 10 100 1000 Integrator 50Hz 1 10 Direct Current Analog Input 1 2...

Страница 73: ...ation Type CH GND 3kVp Isolation Schematic Buffer Input 1M Input Impedance Positive Trigger Voltage Adjustable 0 50V CH1 2 Negative Trigger Voltage Adjustable 0 50V CH1 2 Trigger Resolution 12mV EXT P...

Страница 74: ...D Power consumption Typ 40W Weight 4 1Kg Size width x length x height 298 x 225 x 95 mm Temperature range Operating 0 C 60 C Storing 20 C 80 C 6 5 Scope of Delivery Besides the instrument the followin...

Страница 75: ...on cycle This keeps the instrument within specification for the next calibration cycle and provides the best stability in the long run Before your instrument is delivered it is calibrated Detailed cal...

Страница 76: ...d Analysis updates 11 01 2021 Version 1 6 EN50160 PQM Events Multisystems Export 22 02 2021 Version 1 7 PQA8000H 30 04 2021 Version 1 8 Events description 12 08 2021 Version 1 9 Report Generator Conta...

Отзывы: