Section 16- Troubleshooting
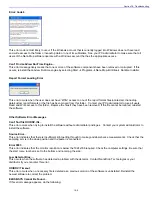
Detector saturation- nucleic acid
measurement
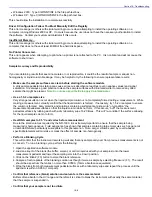
Detector saturation- Bradford
measurement
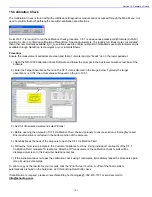
A spectrum that is very “un-smooth” or “ragged” can be caused by insufficient light intensity reaching the spectrometer. If
you suspect that this is occurring, refer to the “Technical Service” section for instructions on how to contact NanoDrop
Technologies and what information must be sent to allow for diagnosing the problem.
Technical Service
If after referring to the above troubleshooting tips you are unable to resolve your problem, please contact your local
distributor or NanoDrop Technologies at
for help. The following information will be very helpful:
•
Serial Number of the instrument
The number can be found on the bottom of the unit.
•
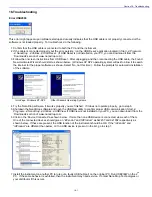
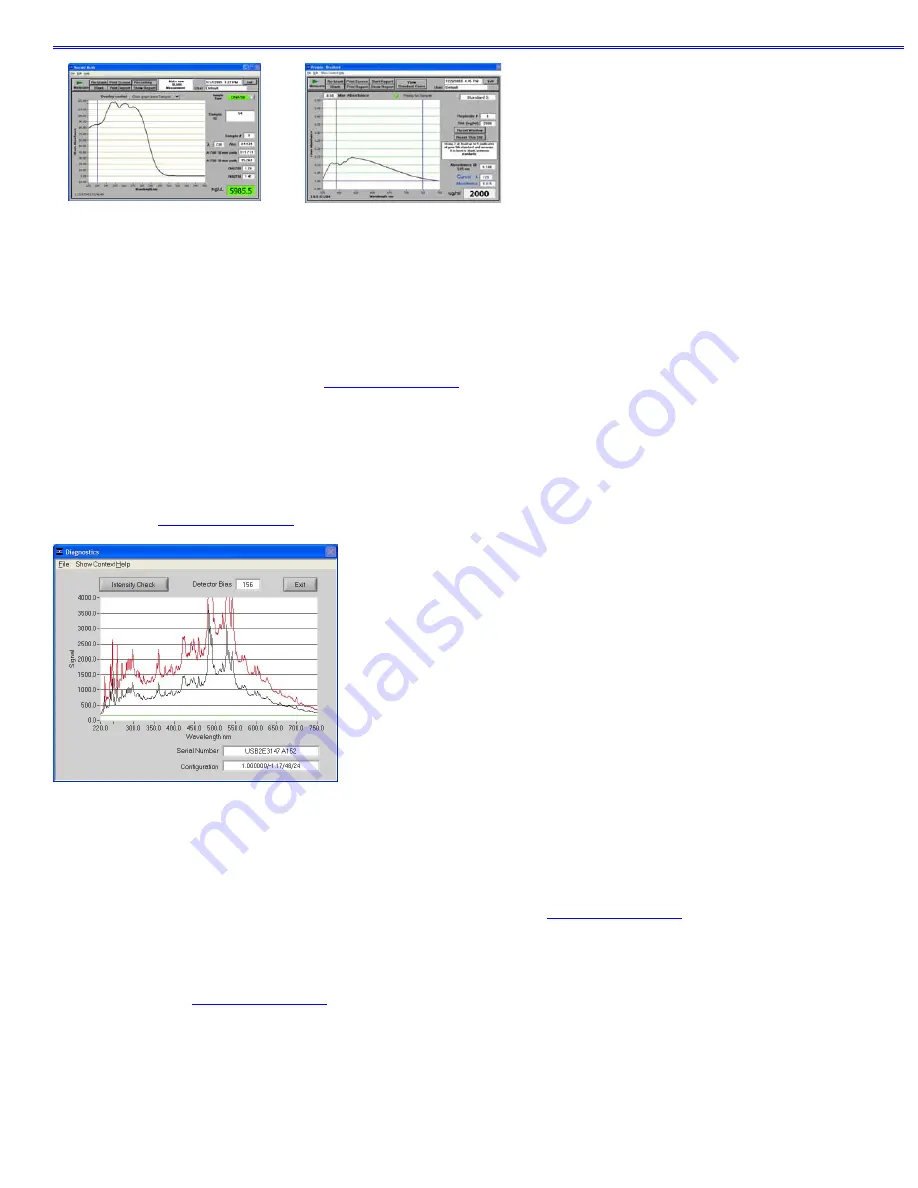
JPG image of Utilities and Diagnostics module
To get this, open this module and select ‘OK’ to initialize the module. Select ‘Intensity Check’. Once the spectrum has
been created, choose File
Æ
Save Window as shown below. Save to your hard drive and email as an attachment to your
distributor or to
.
•
Application Module Screen Captures
Screen captures of the actual spectrum as seen on your PC are of great use in diagnosing problems. Making a screen
capture is quite easy. When in an application module, press ‘Alt+Print Screen’. This copies the highlighted screen
window to the PC’s clipboard. Next, paste this screen capture into MS Word, MS Paint (this program usually comes
standard with the PC and can usually be found in the Start
Æ
Accessories menu), or other graphics programs. Save this
as a .jpg or .doc file and send as email attachment to your distributor or to
.
Data Archive Files
If you have questions about your data, please send the archive file containing the suspect data as an email attachment to
your distributor or to
. The archived file can be found at
C:\NanoDrop Data
Æ
User name
Æ
Application Module
(BCA Protein, Bradford, Cell Culture, Protein Lowry, Proteins and Labels, MicroArray, Nucleic Acid,
Protein A-280, UV-Vis or UV-Vis HiAbs).
16-8

