Section 16- Troubleshooting
Measuring samples at or near the detection limit will result in measurements that can vary a significant amount. Refer
to the ‘Measurement Concentration Range’ of the application module that you are using for the applicable
measurement range.
Confirm instrument accuracy and reproducibility with CF-1
This is a potassium dichromate calibration standard available from NanoDrop Technologies and its distributors. It is a
good practice to check the instrument’s performance every six months with a fresh vial of CF-1.
260/280 Ratio
Many researchers encounter a consistent 260/280 ratio change when switching from a standard cuvette
spectrophotometer to the NanoDrop
®
ND-1000 spectrophotometer. The three main causes for this are listed below:
Change in sample acidity
Small changes in solution pH will cause the 260:280 to vary
**
. Acidic solutions will under-represent the 260:280 ratio by
0.2-0.3, while a basic solution will over-represent the ratio by 0.2-0.3. If comparing the NanoDrop
®
ND-1000
Spectrophotometer to other spectrophotometers, it is important to ensure that the pH of an undiluted sample measured on
the ND-1000 is at the same pH as the diluted sample measured on the second spectrophotometer.
**
William W. Wilfinger, Karol Mackey, and Piotr Chomczynski,
Effect of pH and Ionic Strength on the Spectrophotometric Assessment of
Nucleic Acid Purity:
BioTechniques 22:474-481 (March 1997)
Wavelength accuracy of the spectrophotometers
Although the absorbance of a nucleic acid at 260nm is generally on a plateau, the absorbance curve at 280nm is quite
steeply sloped. A slight shift in wavelength accuracy will have a large effect on 260:280 ratios. For example, a +/- 1 nm
shift in wavelength accuracy will result in a +/- 0.2 change in the 260:280 ratio. Since many spectrophotometers claim a 1
nm accuracy specification, it is possible to see as much as a 0.4 difference in the 260:280 ratio when measuring the same
nucleic acid sample on two spectrophotometers that are both within wavelength accuracy specification.
Nucleotide mix in your sample
The five nucleotides that comprise DNA and RNA exhibit widely varying 260:280 ratios
**
. The following represent the
260:280 ratios estimated for each nucleotide if measured independently:
Guanine: 1.15
Adenine:
4.50
Cytosine: 1.51
Uracil:
4.00
Thymine: 1.47
The resultant 260:280 ratio for the nucleic acid being studied will be approximately equal to the weighted average of the
260:280 ratios for the four nucleotides present. It is important to note that the generally accepted ratios of 1.8 and 2.0 for
DNA and RNA are “rules of thumb”. The actual ratio will depend on the composition of the nucleic acid. Note: RNA will
typically have a higher 260:280 ratio due to the higher ratio of Uracil compared to that of Thymine.
**
Leninger, A. L.
Biochemistry
, 2
nd
ed., Worth Publishers, New York, 1975
Unusual Spectrum
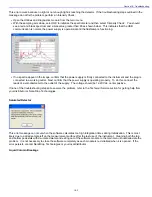
A sample that exhibits jagged “cuts” out of the spectrum, but an otherwise normal shape, may be the result of detector
saturation. This can be caused by the software selecting too high of an integration time due to a dirty sample pedestal
upon startup. Try cleaning both sample pedestals thoroughly and restarting the software. For reference, examples of
spectra generated with a saturated detector are shown below.
16-7


