USB-5100 Series Software Help
Modifying a Plot
47
4.
In the
Resultant Series Name
field, keep the default name or type a new one.
5.
Type any
User Notes
concerning the series you are creating (optional).
6.
Click
Create New Series
.
If you ran the assistant from the Launch Logger dialog box, the Scaling button displays the number of
newly created series.
If using this assistant while plotting, the new series is listed and selected in the Plot Setup dialog. Click the
Plot button to display the series.
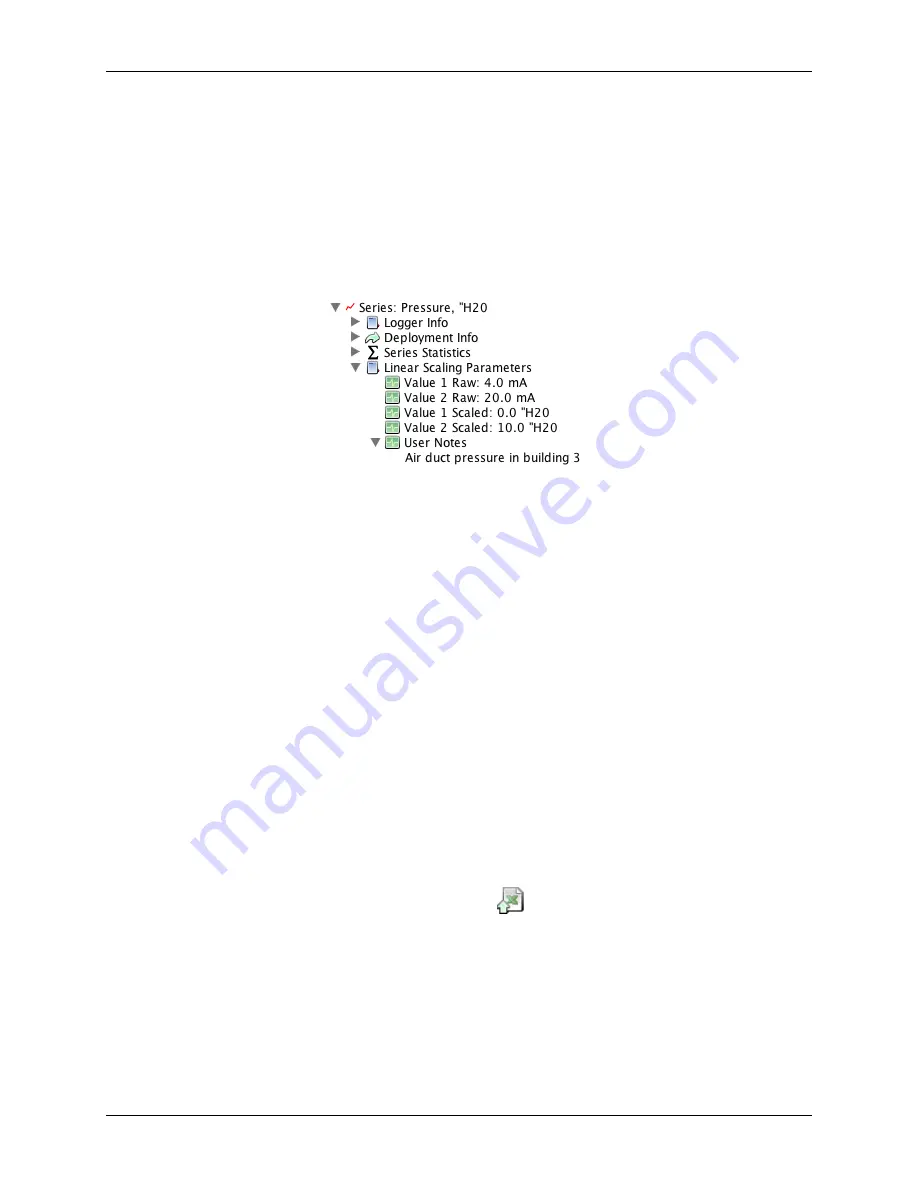
The scaled series appears in the plot immediately or when you read out the logger if configuring this at
launch time. The settings for the scaled series are listed in the Details pane of the plot.
Figure 28. Scaled Series in Details Pane
After the plot is displayed, you can apply minimum, maximum, and average filters to the scaled series as you
would for any sensor data series.
Exporting Data
While USB-5100 Series offers many tools for analyzing data, there may be instances where you need to export
data for use in other software. Refer to the following for exporting data and other related topics:
Copying Points Data into Another Application
Formatting the Date/Time Column in Excel
Exporting Table Data
You can export the data shown in the points table to a Microsoft Excel file or to a text file (.
csv
or
.txt
) for
importing into other applications.
To export data, complete the following steps:
1.
From USB-5100 Series files: Open a data or project file. Make sure the points table includes the series you
want to export. This might include series pasted from other data files or series derived through filters .
Make any changes as necessary.
2.
Select
File»Export Table Data
or click the Export icon
on the toolbar.


