


SR1 Operation Manual
22
© 2014 Stanford Research Systems
the sampling rate for the FFT analyzer is also 64 kHz. Just underneath is the control for setting the
number of FFT lines (resolution). The resolution can be set to values between 256 lines and 32k lines.
Unlike most Audio Analyzers, SR1's FFT analyzer doesn't operate at a fixed frequency range from DC to
Fs/2. The Bandwidth control allows setting the measurement range to Fs/2, Fs/4, etc., all the way down
to Fs/2048. The full FFT resolution is applied to this narrower frequency range, which can be moved to
any position in the range of DC to Fs/2 using the "Start," "Center," and "End" controls. We will illustrate
this shortly.
Averaging can be applied to the FFT to lower the shot-to-shot variation in the noise, or in some cases to
actually lower the amount of noise. Select 5 averages in the "# Avgs" field to create a nice stable FFT
display.
To display the FFT results we'll need to create a graph. Click on "Page 2" of the page control to give us
some room for the graph and click on the
icon to create a new graph. Maximize the graph with the
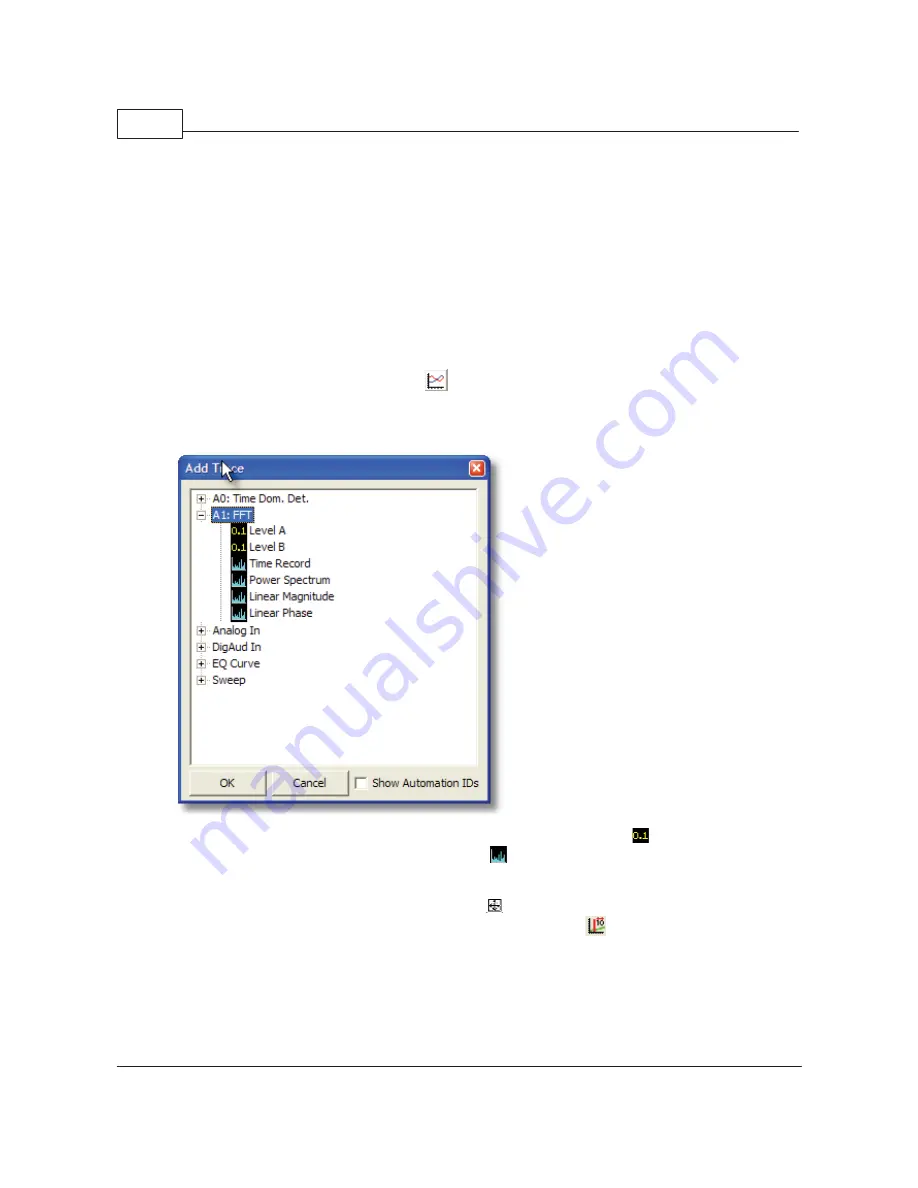
standard maximize control in the upper right. Now we need to add some data to the graph. Click the
"Plus" sign icon at the top left of the graph to add a trace to the graph. The "Add Trace" menu appears.
Open the "A1 FFT" node to see the measurements produced by the A1 FFT analyzer.
Note that scalar measurements, like frequency or level, are denoted with the
icon while vector
measurements like spectra are accompanied by the
icon. Select "Power Spectrum", click ok, and
the FFT will appear. Since we're looking at a very wide dynamic range, some logarithmic units will help.
Click on the "Ymax" Unit Entry and change the Y units to "dBVrms". Now click the "Log" box in the X
axis row to select a logarithmic X-axis. Click on the
icon (autoscale) on the graph speedbar to
autoscale the display. Now turn on the graph cursors by clicking the
icon. Use the knob or the
mouse to drag cursors as shown below. The graph should look like this:
Содержание SR1
Страница 5: ...Part I Getting Started Audio...
Страница 7: ...Getting Started 7 2014 Stanford Research Systems...
Страница 12: ...SR1 Operation Manual 12 2014 Stanford Research Systems...
Страница 27: ...Part II SR1 Operation Audio...
Страница 156: ...SR1 Operation Manual 156 2014 Stanford Research Systems Passband Group Delay of Elliptical Filter...
Страница 258: ...SR1 Operation Manual 258 2014 Stanford Research Systems...
Страница 272: ...SR1 Operation Manual 272 2014 Stanford Research Systems on the amplitude sweep...
Страница 289: ...SR1 Operation 289 2014 Stanford Research Systems...
Страница 290: ...Part III SR1 Reference Audio...