LBXXXA Series USB Powe
™
Product Manual PMA (Power Meter Application)
Revision: 08/02/11
- 21 -
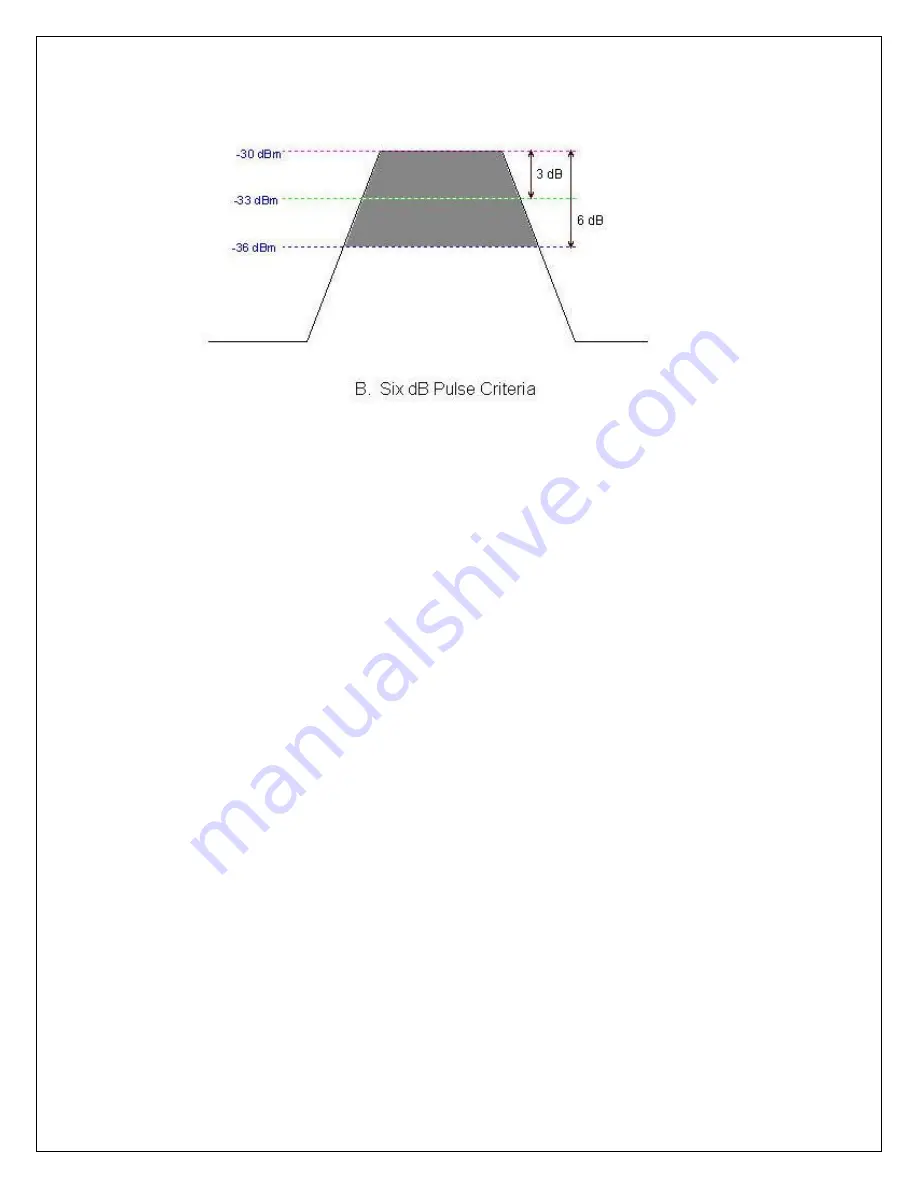
In diagram B, the peak value remains -30 dBm and the darkly shaded area represents the portion of the pulse that will
be used to determine pulse power and duty cycle using a 6 dB peak criteria. You can see that the average in diagram
B will be lower than the average in diagram A.
Pulse Peak Criteria (LB4XXA/LB6XXA models only)
There are a number of parameters that can affect pulse measurements. One of particular concern is the pulse peak
criteria. Pulse peak criteria is relative to the measured peak value and changes will affect the duty cycle and pulse
power. The affects will be most pronounced for pulses that have sloped rising and falling edges.
While peak measurement results can be obtained as low as -60 dBm and at rates as fast as 3 MHz, with pulse widths
less than 250 nsec, the best measurements require some care. For best results, you can make pulse measurements
when the pulse power is about 6 dB above the peak noise with averages set from about 50 to 100.
The best method to determine peak noise is to make a peak measurement with the signal off and then examine the
peak power reading.
Additionally, as the duty cycle decreases you may need to increase averaging; and as PRF increases you can
decrease the number of averages. A good starting point is about 100 buffers or averages for a PRF of 10 kHz and a
duty cycle of 10%. Adjust the averages inversely proportional to the PRF and duty cycle - so if the PRF doubles you
might be able to cut the averages by half. As a rule of thumb, it is good practice to keep the number of averages
above 50 unless you need the additional speed.


