background image

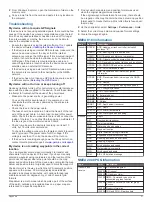
to the instructions for your satellite weather and radio 

equipment.

Weather Data Broadcasts

Weather data is broadcast at different intervals for each weather 

feature. For example, radar is broadcast at five-minute intervals. 

When the Garmin receiver is turned on, or when a different 

weather feature is selected, the receiver must receive new data 

before it can be shown. You might experience a delay before 

weather data or a different feature appears on the chart.

NOTE: 

Any weather feature can change in appearance if the 

source that provides the information changes.

Changing the Weather Chart

1

From a combination screen or SmartMode layout with a 

weather chart, select 

Menu

 > 

Weather Menu

 > 

Change 

Weather

.

2

Select a weather chart.

Viewing Precipitation Information

Precipitation ranging from very light rain and snow, up to strong 

thunderstorms, is indicated in varying shades and colors. 

Precipitation is shown either independently or with other weather 

information.

Select 

Charts

 > 

Precipitation

.

The time stamp in the upper-left corner of the screen 

indicates the elapsed time since the weather data provider 

last updated the information.

Precipitation Views

From the precipitation weather chart, select Menu.

RADAR Loop

: Shows precipitation information as an image of 

the latest update or as an animated loop of the latest 

updates. The time stamp indicates the elapsed time since the 

service provider generated the weather radar frame currently 

displayed on the screen.

Cloud Cover

: Shows cloud cover data.

Waypoints

: Shows waypoints.

Legend

: Shows the weather legend.

Storm Cell and Lightning Information

Storm cell are represented by 

 on the weather precipitation 

chart. They indicate both the present position of a storm and the 

projected path of that storm in the immediate future.
Red cones appear with a storm cell icon, and the widest part of 

each cone points in the direction of the projected path of the 

storm cell. The red lines in each cone indicate where the storm 

will most likely be in the near future. Each line represents 15 

minutes.
Lightning strikes are represented by  . Lightning appears on the 

weather precipitation chart if strikes were detected within the last 

seven minutes. The ground-based lightning detection network 

detects cloud-to-ground lightning only.

NOTE: 

This feature is not available on all devices and in all 

subscriptions.

Hurricane Information

The weather Precipitation chart can show the present position of 

a hurricane  , a tropical storm, or a tropical depression. A red 

line stemming from a hurricane icon indicates the projected path 

of the hurricane. Darkened dots on the red line indicate the 

projected locations through which the hurricane will pass, as 

received from the weather data provider.

Weather Warnings and Weather Bulletins

When a marine weather warning, weather watch, weather 

advisory, weather bulletin, or other weather statement is issued, 

shading indicates the area to which the information applies. The 

aqua lines on the chart indicate the boundaries of marine 

forecasts, coastal forecasts, and offshore forecasts. Weather 

bulletins may consist of either weather watches or weather 

advisories.
To view information about the warning or bulletin, select the 

shaded area.

Color

Marine Weather Group

Cyan

Flash Flood

Blue

Flood

Red

Marine

Yellow

Severe Storm

Red

Tornado

Forecast Information

The Forecast chart shows city forecasts, marine forecasts, 

warnings, hurricane warnings, METARS, county warnings, 

weather fronts and pressure centers, surface pressure, and 

weather buoys.

Viewing Forecast Information for Another Time Period

1

Select 

Charts

 > 

Forecast

.

2

Select an option:
• To view the weather forecast for the next 48 hours, in 12-

hour increments, select 

Next Forecast

 multiple times.

• To view the weather forecast for the previous 48 hours, in 

12-hour increments, select 

Previous Forecast

 multiple 

times.

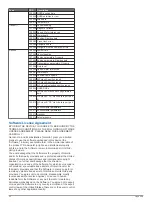
Weather Fronts and Pressure Centers

Weather fronts appear as lines that indicate the leading edge of 

an air mass.

Front Symbol

Description

Cold front

Warm front

Stationary front

Occluded front

Trough

Pressure-center symbols often appear near weather fronts.

Pressure-
Center 
Symbol

Description

Indicates a low-pressure center, which is a region of 
relatively lower pressure. Moving away from a low-
pressure center results in increased pressure. Winds 
flow counterclockwise around low-pressure centers in 
the northern hemisphere.
Indicates a high-pressure center, which is a region of 
relatively higher pressure. Moving away from a high-
pressure center results in decreased pressure. Winds 
flow clockwise around high-pressure centers in the 
northern hemisphere.

Viewing a Marine Forecast or an Offshore Forecast

1

Select 

Charts

 > 

Forecast

.

2

Pan the chart to an offshore location.
The Marine Forecast or Offshore Forecast options appear 

when forecast information is available.

3

Select 

Marine Forecast

 or 

Offshore Forecast

.

32

SiriusXM Weather

Содержание GPSMAP 7400 Series

Страница 1: ...GPSMAP 7400 7600 Series Owner s Manual February 2015 Printed in Taiwan 190 01841 00_0B...

Страница 2: ......

Страница 3: ...ices Destination 8 Waypoints 8 Marking Your Present Location as a Waypoint 8 Creating a Waypoint at a Different Location 8 Marking an SOS Location 8 Viewing a List of all Waypoints 9 Editing a Saved W...

Страница 4: ...23 Radar Gain and Clutter 23 Echo Trails 24 Radar Display Settings 24 Radar Appearance Settings 24 Front of Boat Offset 24 Selecting a Different Radar Source 25 Autopilot 25 Opening the Autopilot Scre...

Страница 5: ...isibility Information for Another Time Period 33 Viewing Buoy Reports 33 Viewing Local Weather Information near a Buoy 34 Creating a Waypoint on a Weather Chart 34 Weather Overlay 34 Turning On the We...

Страница 6: ...ing the Screen 40 Screenshots 40 Capturing Screenshots 40 Copying Screenshots to a Computer 40 Troubleshooting 41 My device will not acquire GPS signals 41 My device will not turn on or keeps turning...

Страница 7: ...ve associated with the memory card and select Next Finish Updating the Device Software Before you can update the software you must obtain a software update memory card or load the latest software onto...

Страница 8: ...n option To change the type of data shown select Overlays select a data field and select the new data type Adding a SmartMode Layout You can add SmartMode layouts to suit your needs Each customization...

Страница 9: ...ogether to zoom out Spread two fingers apart to zoom in Selecting a Map If your product has both BlueChart g2 and LakeV HD built in maps you can select which map to use Not all models have both types...

Страница 10: ...This chart works well for offshore deep sea fishing High Resolution Satellite Imagery Provides high resolution satellite images for a realistic view of the land and water on the Navigation chart Show...

Страница 11: ...continue vessel tracking the lost target symbol disappears from the chart or the 3D chart view Dangerous target in range The target flashes while an alarm sounds and a message banner appears After the...

Страница 12: ...Radio Beacons EPIRB and other man overboard signals Distress signal transmissions are different than standard AIS transmissions so they appear differently on the chartplotter Instead of tracking a dis...

Страница 13: ...adjusts the heading line which is a line drawn on the map from the bow of the boat in the direction of travel and sets the data source for the heading line World Map Uses either a basic world map or...

Страница 14: ...in which I want to go bearing Navigate using Go To See Setting and Following a Direct Course Using Go To How do I make the device guide me along a straight line minimizing cross track to a location u...

Страница 15: ...ine steering to avoid land shallow water and other obstacles Deleting a Waypoint or an MOB 1 Select Info User Data Waypoints 2 Select a waypoint or an MOB 3 Select Review Delete Deleting All Waypoints...

Страница 16: ...estination point used when the route was created to the left of the original route select Backward Port To navigate the route from the destination point used when the route was created to the right of...

Страница 17: ...lable values for the Shoreline Distance setting are relative not absolute To ensure the Auto Guidance line is placed the appropriate distance from shore you can assess the placement of the Auto Guidan...

Страница 18: ...ory During Recording 1 Select Info User Data Tracks Active Track Options 2 Select Record Mode 3 Select an option To record a track log until the track memory is full select Fill To continuously record...

Страница 19: ...ng race 1 Mark the starting line Setting the Starting Line 2 From the Sail Racing combination screen select Menu Start Line Guidance Target Speed and select your target speed when crossing the startin...

Страница 20: ...delay allows you to delay steering a tack and gybe after you initiate the maneuver 1 From the autopilot screen select Menu Autopilot Setup Sailing Setup Tack Delay 2 Select the length of the delay 3 I...

Страница 21: ...ency transducer Panoptix Sonar Views NOTE Not all models support Panoptix transducers To receive Panoptix sonar you need a compatible chartplotter and a compatible transducer ThePanoptix sonar views a...

Страница 22: ...onar module Each chartplotter on the network can display sonar data from every compatible sonar module and transducer on the network no matter where the chartplotters and transducers are mounted on yo...

Страница 23: ...1 From a sonar view select Menu Zoom 2 Select an option To zoom in on the sonar data from the bottom depth select Bottom Lock To set the depth range of the magnified area manually select Set Zoom sel...

Страница 24: ...a different color palette for the bottom select Sonar Setup Bottom Colors and select an option To select a different style for the bottom select Sonar Setup Bottom Style and select an option To hide o...

Страница 25: ...r scheme and color gain Overlay Data Sets the data shown on the sonar screen A Scope Displays a vertical flasher along the right side of the screen that shows instantaneously the range to targets alon...

Страница 26: ...d slot 2 From a sonar view select Menu Sonar Setup Sonar Recording Record Sonar 15 minutes of sonar recording uses approximately 200 MB of space of the inserted memory card You can record sonar until...

Страница 27: ...essary Marking a Waypoint on the Radar Screen 1 From a Radar screen or the Radar overlay select a location 2 Select Create Waypoint Sentry Mode Sentry mode allows you to put the radar into timed trans...

Страница 28: ...ls and select the length of the track that appears VRM and EBL The variable range marker VRM and the electronic bearing line EBL measure the distance and bearing from your boat to a target object On t...

Страница 29: ...the selected radar mode select Auto The chartplotter does not adjust the gain automatically in response to changing conditions To adjust the gain automatically for changing conditions select Auto Low...

Страница 30: ...overlay From a Radar screen or the Radar overlay select Menu Noise Rejection Crosstalk Rej Echo Trails The echo trails feature enables you to track the movement of vessels on the radar display You can...

Страница 31: ...ng the Power Saver percentage reduces rudder activity Enabling Shadow Drive NOTE The Shadow Drive feature is available only on hydraulic steering systems From the autopilot screen select Menu Autopilo...

Страница 32: ...y physically steering the boat Select or to cancel a pattern using step steering mode Select Standby Digital Selective Calling Networked Chartplotter and VHF Radio Functionality If you have a NMEA 018...

Страница 33: ...To select a color for the trail line select Trail Line Deleting a Position Report Call 1 Select Info DSC List 2 Select a position report call 3 Select Review Clear Report Viewing Vessel Trails on the...

Страница 34: ...ine Gauge Status Alarms 1 From the engine gauges screen select Menu Gauge Setup Status Alarms Custom 2 Select one or more engine gauge alarms to turn on or off Setting the Fuel Alarm Before you can se...

Страница 35: ...lestial Information Tide Station Information You can view information about a tide station for a specific date and time including the tide height and when the next high and low tides will occur By def...

Страница 36: ...ongs to Repeat From the media screen select Menu Repeat All Setting Songs to Shuffle 1 From the media screen select Menu Shuffle 2 If necessary select an option Listening to the Radio Saving a Channel...

Страница 37: ...ntrol feature requires you to enter a passcode to tune to the locked channels Select Browse Parental Lock Unlock A list of channels appears A checkmark indicates a locked channel NOTE When you view th...

Страница 38: ...bscriptions Hurricane Information The weather Precipitation chart can show the present position of a hurricane a tropical storm or a tropical depression A red line stemming from a hurricane icon indic...

Страница 39: ...cipitation Isobars packed closely together show a strong pressure gradient Strong pressure gradients are associated with areas of stronger winds Pressure units are shown in millibars mb inches of Merc...

Страница 40: ...rtplotter as well as supported network IP based video cameras encoders and thermal cameras Select A V Gauges Controls Video Selecting a Video Source 1 From the video screen select Menu Source 2 Select...

Страница 41: ...From a video screen touch the screen The video controls appear on the screen 2 Select an option To zoom in and out use the zoom button To pan or tilt the camera use the compass rose TIP Hold in the c...

Страница 42: ...of the screen User Data Sharing Allows you to share waypoints and routes over the Garmin Marine Network All chartplotters that share waypoints and routes must have this setting turned on Menu Bar Disp...

Страница 43: ...vigation and proceed to step 10 If the Auto Guidance line is too close to known obstacles select Settings Preferences Navigation Auto Guidance Shoreline Distance Farthest If the turns in the Auto Guid...

Страница 44: ...n enter a keel offset to compensate the surface reading for the depth of a keel making it possible to measure depth from the bottom of the keel instead of from the transducer location Enter a positive...

Страница 45: ...e name of your chartplotter wireless network Setting Up the Wi Fi Wireless Network 3 Enter the network password Changing the Wireless Channel You can change the wireless channel if you have trouble fi...

Страница 46: ...elect Info User Data Data Transfer Replace from Card Saving System Information to a Memory Card You can save system information to a memory card as a troubleshooting tool A product support representat...

Страница 47: ...oint location to transfer and share data from one device to the next If you have manually entered a waypoint using coordinates and the location of the point does not appear where the point should be t...

Страница 48: ...FTWARE LICENSE AGREEMENT PLEASE READ THIS AGREEMENT CAREFULLY Garmin Ltd and its subsidiaries Garmin grant you a limited license to use the software embedded in this device the Software in binary exec...

Страница 49: ...ngine gauges 28 configuring 28 status alarms 28 EPIRB 6 event log 36 F factory settings 39 stations 2 favorites 2 Fish Eye 3D sonar cone 7 suspended targets 7 tracks 7 fishing chart 3 34 boundary line...

Страница 50: ...18 gain 16 interference 19 measuring distances 16 noise 16 17 Panoptix 15 16 18 19 recording 20 scroll speed 18 sharing 16 SideV 15 source 16 surface noise 19 suspended targets 19 views 14 16 waypoin...

Страница 51: ......

Страница 52: ...02 36 699699 52 001 855 792 7671 0800 0233937 47 815 69 555 00800 4412 454 44 2380 662 915 35 1214 447 460 386 4 27 92 500 0861 GARMIN 427 646 27 0 11 251 9999 34 93 275 44 97 46 7744 52020 886 2 2642...

Отзывы: