


Maestro Navigator 3.5.3.doc
124
Sonar History
As sonar data is received, it streams across the screen from right to left. The newest
data appears at the right side of the screen, then moves out of view to the left.
© 2007 NSI, inc
To review sonar readings received hours, or even days, earlier, just drag the Sonar
screen to scroll back (left) through the data. The Sonar history can hold 72 hours worth
of data. Whenever the sounder is running, the data is being recorded (regardless of
whether you’re viewing the Sonar data on the screen). Once 72 hours have elapsed, the
oldest data is gradually replaced by the new data being received. The history always
contains the last 72 hours of running time, unless you manually clear the history.
View Sonar History
Why look back at the Sonar history? Suppose, for example, that you saw a large school
of fish hanging around a big rock earlier in the day and now you want to return to where
they were seen. Scroll back through the Sonar history until you find the fish, and then
you can split the screen with the contour window or nautical chart to see where those
fish were.
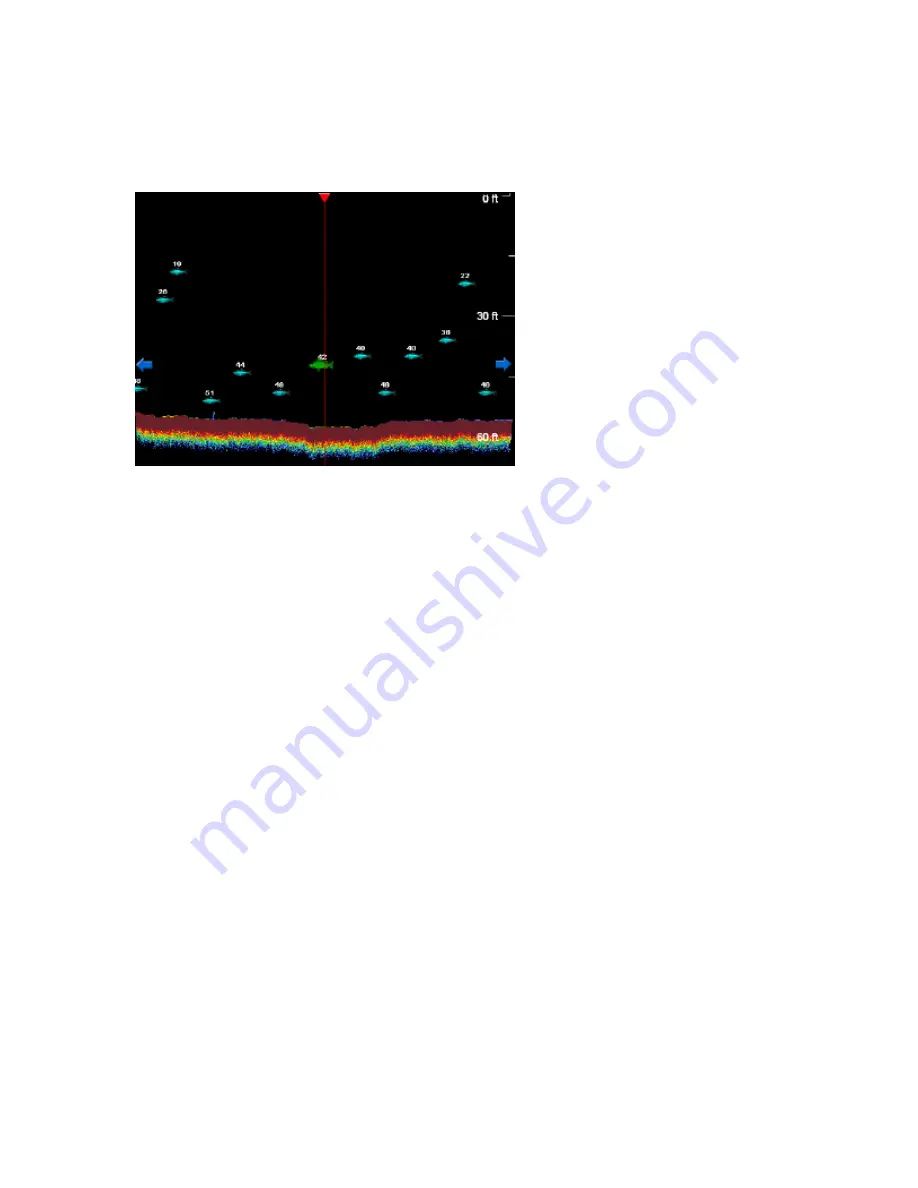
To look back through the Sonar history, just drag your finger from left to right across the
Sonar screen. To scroll faster, hold your finger on either of the blue arrows at the sides
of the screen, then lift it when you want to stop scrolling. You can drag or scroll in either
direction (forward or backward in time).
As you view the history, a vertical red line appears on the Sonar data. The time and
date shown at the top of the screen refers to the point in time marked by the vertical red
line on the Sonar screen. As you scroll back through the Sonar history, you can see the
date and time that the data was recorded. You can also see the depth, surface water
temperature and vessel latitude and longitude at the time the data was acquired.
A green line along the bottom of the screen indicates the surface water temperature
trend. The temperature is recorded every two seconds and plotted in this line graph:
rises in the line indicate rises in temperature, dips indicate lowering temperature, and a
flat line indicates steady temperature.
Latest Data
When you are done reviewing the Sonar history, press the
Sonar
button and the Sonar
screen will resume normal operation. (If you have set Maestro Navigator to link to your
Содержание Maestro
Страница 1: ...User s Manual TM IS0270 rev A ecr 8171 3 2010 ...
Страница 2: ......
Страница 8: ......
Страница 50: ......
Страница 68: ......
Страница 86: ...Maestro Navigator 3 5 3 doc 82 ...
Страница 90: ......
Страница 94: ...Maestro Navigator 3 5 3 doc 90 ...
Страница 122: ......
Страница 140: ......
Страница 142: ......


