


146
| Monitoring
Dell PowerConnect W-Series Instant Access Point 6.1.2.3-2.0.0.0
| User Guide
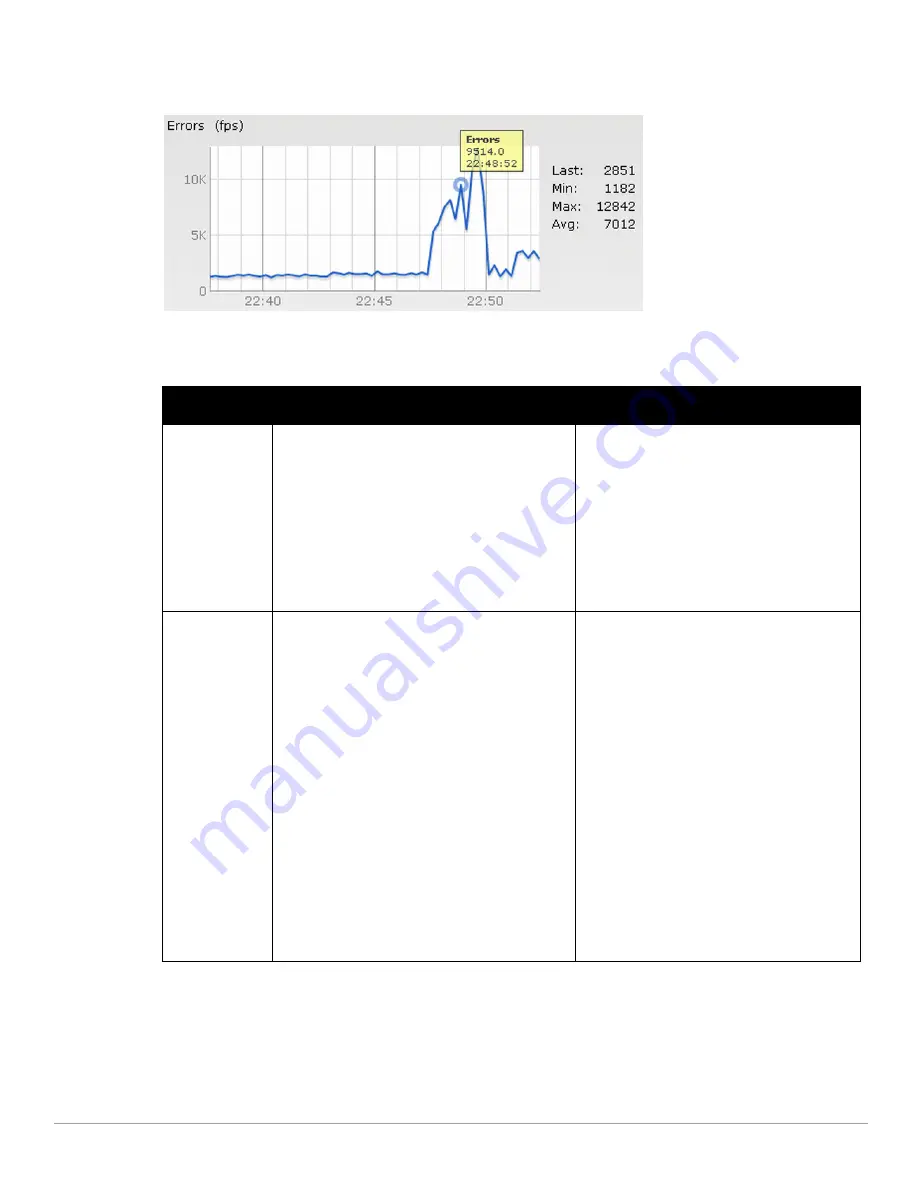
Throughput
Figure 113
Throughput Graph
For more information about RF trends graphs in the client view and for monitoring procedures, see
Table 25
.
Table 25
Client View—RF Trends Graphs and Monitoring Procedures
Graph Name
Description
Monitoring Procedure
Signal
The Signal graph shows the signal strength of the
client for the last 15 minutes. It is measured in
decibels.
To see an enlarged view, click the graph.
The enlarged view provides Last, Minimum,
Maximum, and Average signal statistics for the
client fr the last 15 minutes.
To see the exact signal strength at a particular time,
hover the cursor over the graph line.
To monitor the signal strength of the selected
client for the last 15 minutes,
1.
Log in to the Instant UI. The Virtual Controller
view appears. This is the default view.
2.
In the Clients tab, click the IP address of the
client for which you want to monitor the signal
strength. The client view appears.
3.
Study the Signal graph in the RF Trends pane.
For example, the graph on the left shows that
signal strength for the client is 54.0 dB at 12:23
hours.
Frames
The Frames Graph shows the In and Out frame rate
per second for the client for the last 15 minutes. It also
shows data for the Retry In and Retry Out frames.
Outgoing frames—Outgoing frame traffic is
displayed in green. It is shown above the median
line.
Incoming frames—Incoming frame traffic is
displayed in blue. It is shown below the median
line.
Retry Out—Retries for the outgoing frames is
displayed in black and is show above the median
line.
Retry In—Retries for the incoming frames is
displayed in red and is shown below the median
line.
To see an enlarged view, click the graph.
The enlarged view provides Last, Minimum,
Maximum, and Average statistics for the In, Out,
Retries In, and Retries Out frames.
To see the exact frames at a particular time, hover the
cursor over the graph line.
To monitor the In and Out frame rate per second
and retry frames for the In and Out traffic, for the
last 15 minutes,
1.
Log in to the Instant UI. The Virtual Controller
view appears. This is the default view.
2.
In the Clients tab, click the IP address of the
client for which you want to monitor the
frames. The client view appears.
3.
Study the Frames graph in the RF Trends pane.
For example, the graph on the left shows 4.0
frames per second for the client at 12:27 hours.
Содержание PowerConnect W-IAP175P
Страница 1: ...Dell PowerConnect W Series Instant Access Point 6 1 2 3 2 0 0 0 User Guide ...
Страница 8: ...8 Contents Dell PowerConnect W Series Instant Access Point 6 1 2 3 2 0 0 0 User Guide ...
Страница 12: ...12 Figures Dell PowerConnect W Series Instant Access Point 6 1 2 3 2 0 0 0 User Guide ...
Страница 14: ...14 Tables Dell PowerConnect W Series Instant Access Point 6 1 2 3 2 0 0 0 User Guide ...
Страница 38: ...38 Instant User Interface Dell PowerConnect W Series Instant Access Point 6 1 2 3 2 0 0 0 User Guide ...
Страница 58: ...58 Mesh Network Dell PowerConnect W Series Instant Access Point 6 1 2 3 2 0 0 0 User Guide ...
Страница 72: ...72 Managing IAPs Dell PowerConnect W Series Instant Access Point 6 1 2 3 2 0 0 0 User Guide ...
Страница 74: ...74 NTP Server Dell PowerConnect W Series Instant Access Point 6 1 2 3 2 0 0 0 User Guide ...
Страница 96: ...96 Authentication Dell PowerConnect W Series Instant Access Point 6 1 2 3 2 0 0 0 User Guide ...
Страница 102: ...102 Role Derivation Dell PowerConnect W Series Instant Access Point 6 1 2 3 2 0 0 0 User Guide ...
Страница 110: ...110 Instant Firewall Dell PowerConnect W Series Instant Access Point 6 1 2 3 2 0 0 0 User Guide ...
Страница 114: ...114 OS Fingerprinting Dell PowerConnect W Series Instant Access Point 6 1 2 3 2 0 0 0 User Guide ...
Страница 126: ...126 Intrusion Detection System Dell PowerConnect W Series Instant Access Point 6 1 2 3 2 0 0 0 User Guide ...
Страница 148: ...148 Monitoring Dell PowerConnect W Series Instant Access Point 6 1 2 3 2 0 0 0 User Guide ...


