Monitoring Equalizer Operation
Equalizer Installation and Administration Guide
41
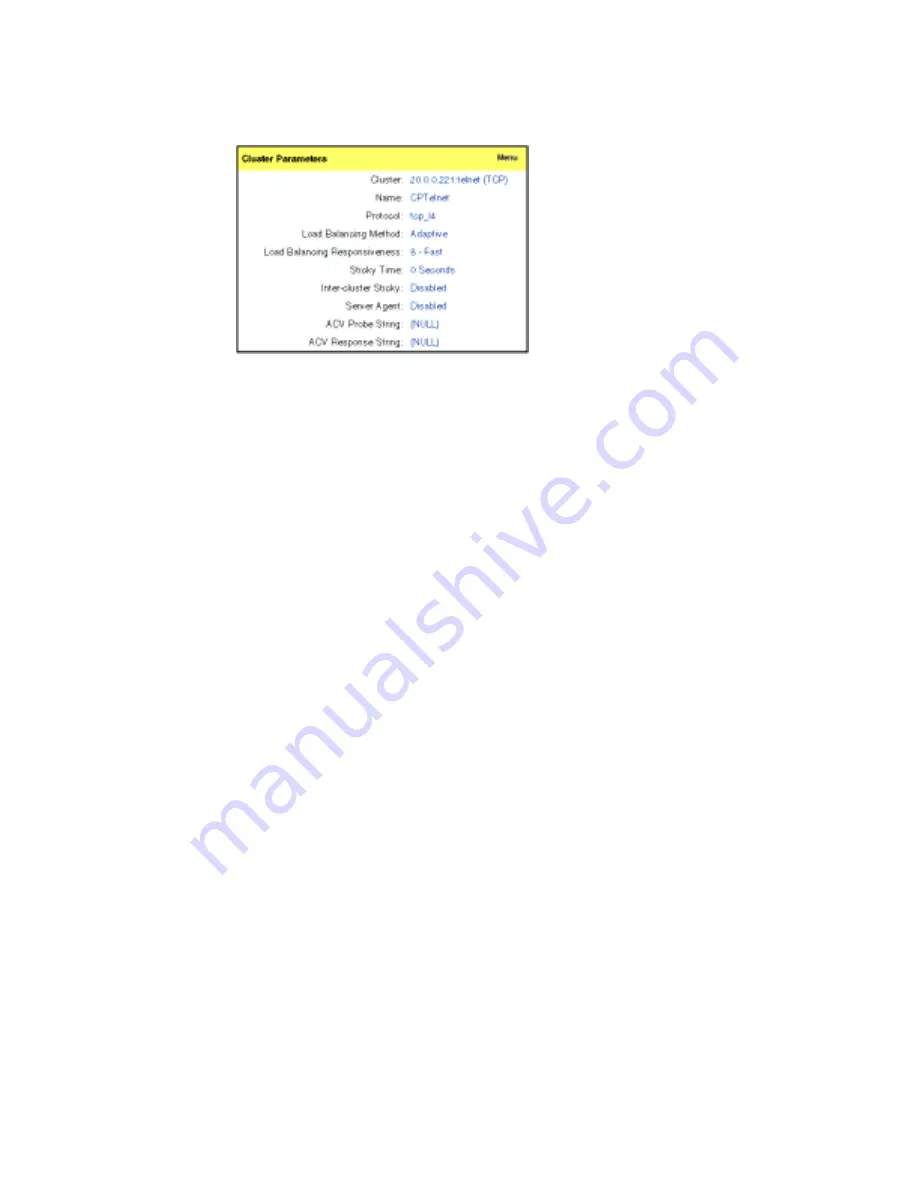
Figure 25 Viewing cluster information
This display shows the selected load balancing policy, the load-balancing responsiveness
setting, the persistence parameters, and the server agent parameters. For more information
about how Equalizer uses these parameters, see “Adding a Virtual Cluster” on page 62.
Plotting Cluster Performance
The Plot Cluster feature enables you to view a graphical representation of the performance
history for any cluster. To plot the performance history for a cluster:
1.
Log into the Equalizer Administration interface with view or edit access.
2.
In the left frame, click the name of the cluster whose history you want to view.
3.
Select Plot Cluster History from the local menu in the Cluster Parameters frame. The
graphical history for the selected cluster is displayed, as shown in Figure 26.
By default, the service time and active connections are plotted for the previous five
minutes. To change the information plotted, select the categories and duration you
want to plot and click the Plot button.
To zoom in on a portion of the graph, click the area that you are interested in.
Five values can be plotted for a cluster:
■
Active connections
—the total number of active connections on the servers in the
cluster.
■
Service time
—the average service time of all of the servers in the cluster. The service
time is the time it takes a server to start sending reply packets once it receives a client
request. The average service time is a good indication of the overall performance of the
cluster.
■
Computed load
—the average computed load of all of the servers in the cluster.
Because server computed loads are normalized by the cluster-wide average, the
cluster-wide average should be 100. Certain events can cause spikes in the computed
load for the cluster, such as rapid fluctuations in the load, rebooting servers, and
restarting application daemons such as httpd.
■
Hit rate
—the number of connections served by the cluster each second. This is a good
indication of how many “hits” the site is getting.
Содержание Equalizer
Страница 2: ......
Страница 4: ...iv Coyote Point Systems Inc ...
Страница 32: ...Chapter 2 Installing Equalizer 22 Equalizer Installation and Administration Guide ...
Страница 42: ...Chapter 3 Configuring Equalizer 32 Equalizer Installation and Administration Guide ...
Страница 70: ...Chapter 4 Administering Equalizer Operation 60 Equalizer Installation and Administration Guide ...
Страница 104: ...Chapter 6 Administering Geographic Clusters 94 Equalizer Installation and Administration Guide ...
Страница 108: ...Chapter 7 Troubleshooting 98 Equalizer Installation and Administration Guide ...
Страница 114: ...Appendix B Using Reserved IP Addresses 104 Equalizer Installation and Administration Guide ...
Страница 118: ...Appendix C Regular Expression Format 108 Equalizer Installation and Administration Guide ...
Страница 130: ...Appendix E Technical Specifications 120 Equalizer Installation and Administration Guide ...
Страница 136: ...Appendix F License and Warranty 126 Equalizer Installation and Administration Guide ...


