70
When the desired file has a checkmark to its
left, click on the “Receive and View” button to transfer the
data log from ATPOL II
to PSM and immediately start looking at the data. Or click on the “Receive
Only” button to simply receive the data log.
Viewing Consumption Logs
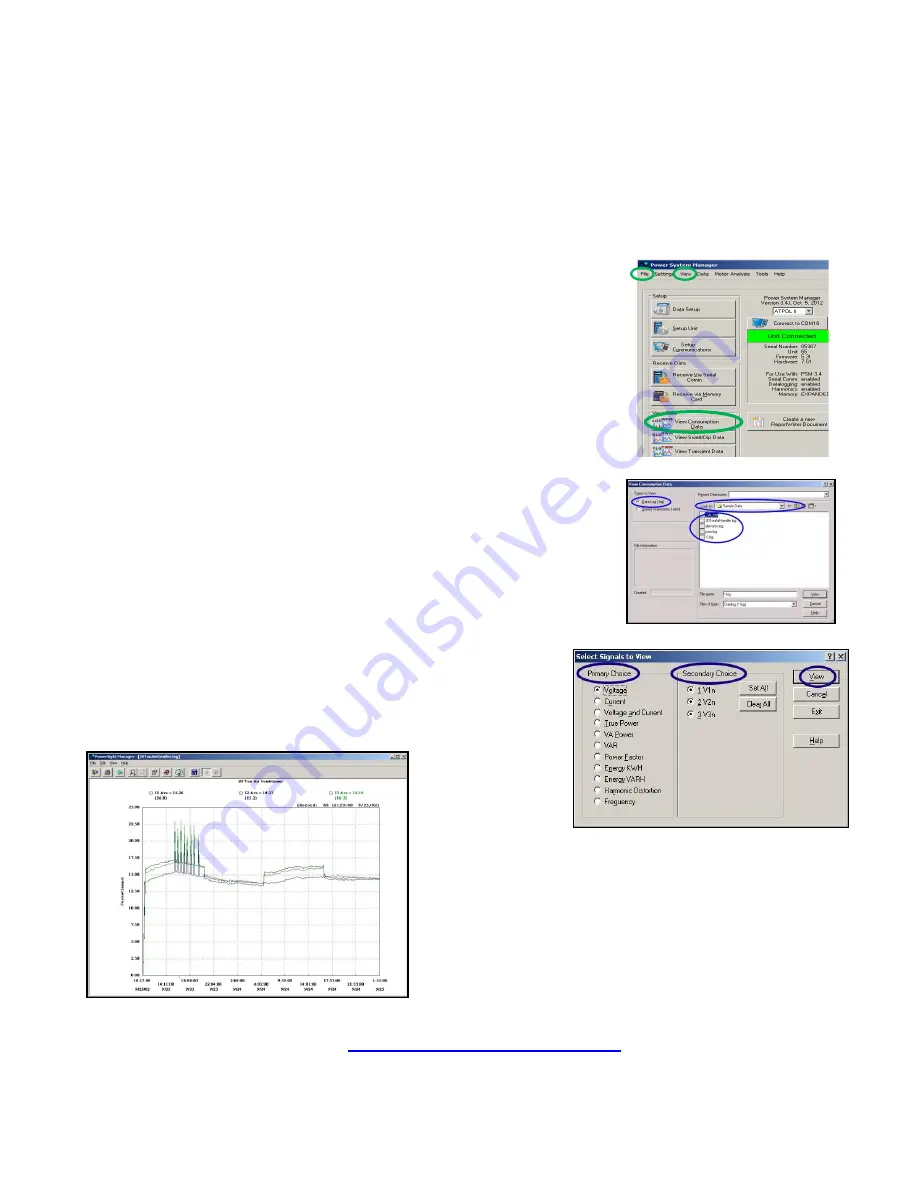
To select a consumption log to view, at the main menu, click on “View
Consumption Data”, or click on “View” and then “View Consumption
Data”, or click on “File” and then “View Consumption Data”. Any of
these approaches will result in the View Consumption Data screen being
shown
. In the “Types to View” section, click on “Data Log”, if necessary,
to select that choice. A list will appear of all consumption logs located in
the directory shown in the “Look In” box. If you wish to look in a different
directory, use the standard Windows methods for changing the directory
that is shown. Next, select a specific consumption log by double clicking
on it.
When you select a consumption log to view, the “Select Signals to View”
window pops open. You must make a primary choice of what type of
measurement you wish to view, such as Voltage, Current, or True
Power, and then make a secondary choice of which phase or phases to
view, then click on “View”. Choices of measurement types that are not
available in the log will be “grayed” out.
At this point, a view of the log will be displayed. Generally, if you chose
two or more phases, the averages of each of the phases will be
graphed. If you chose one phase to view, the maximum,
minimum, and average of the phase measurement will be
graphed. Of course, average, maximum, or minimum will only be
displayed if that measurement type was included in the data
setup.
To learn ways to manipulate, interpret, and present the data for better data analysis or improved
presentation, refer to the chapter on
Working with Graphs and Waveforms
Содержание ATPOL II
Страница 109: ...109...


