3
Displayed Frequency Range
:
Displayed in the lower left of the screen, they indicate the frequency
endpoints displayed on the chart. When there are no cursors enabled, the upper frequency is
displayed near the lower right corner of the chart.
Cursor Frequency:
For each cursor enabled, the cursor's frequency is displayed as shown. In the
above illustration, the cursor frequency is displayed highlighted-- indicating that it is selected, and that
its cursor can be moved using the LEFT & RIGHT arrow buttons. As the cursor is moved, this
frequency value is updated.
Left & Right Scale Cursor Values:
Immediately to the right of the cursor frequency, are the Scale
Cursor Values. These are the measurements for the frequency at which the cursor is positioned.
They are updated for every sweep.
It should be noted, that all of the above elements are common to both the VNA and SWR mode
screens.
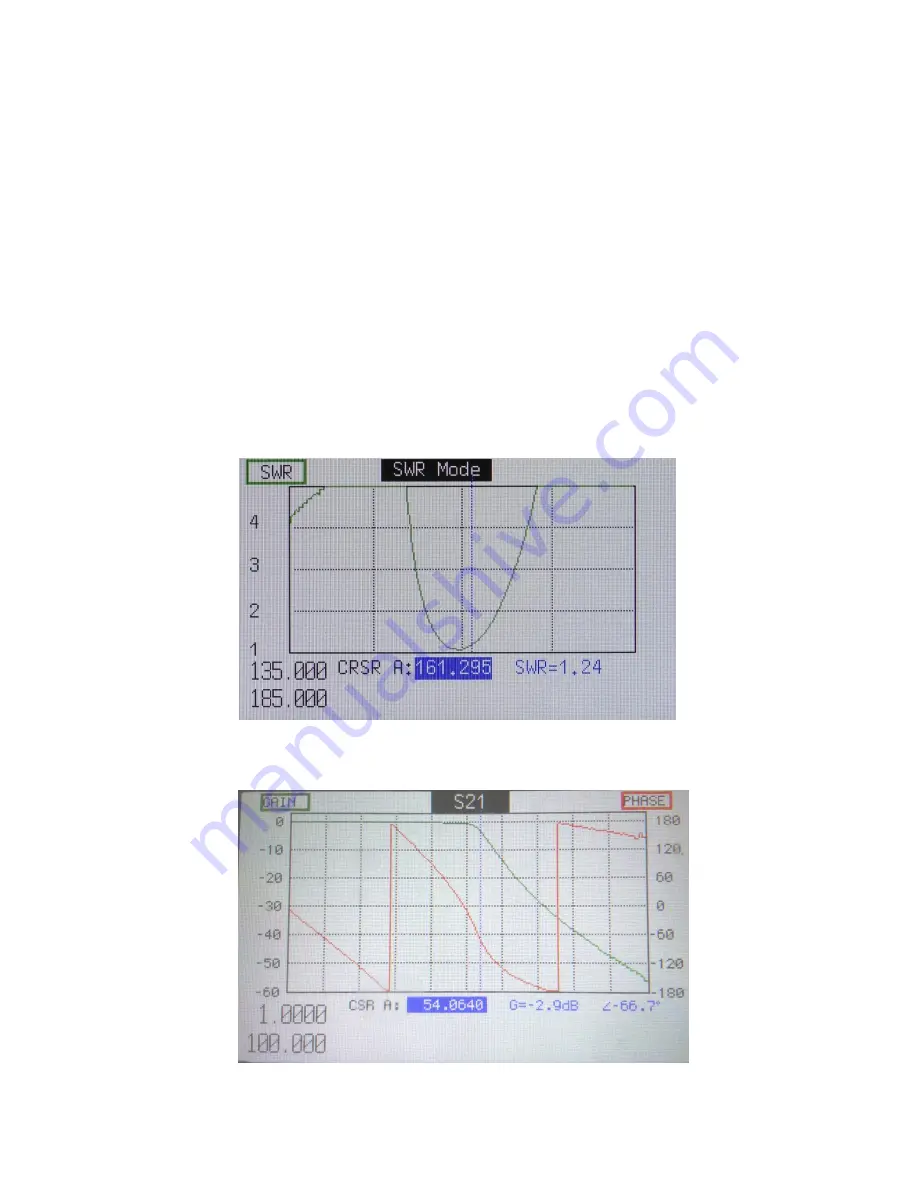
SWR & Return Loss Screen
Very similar to the VNA screen, except that there is only one trace visible at a time; either the SWR or
Return Loss. The cursors and scale work the same otherwise. The color of the frame drawn around
the label is always the same color as the trace using that scale.
S21 Screen (two-port)
Shown here is the S21 Screen:


