30
Limit Lines
The Limit Line feature allows the user to perform quick go/no-go testing on tunable resonators. The
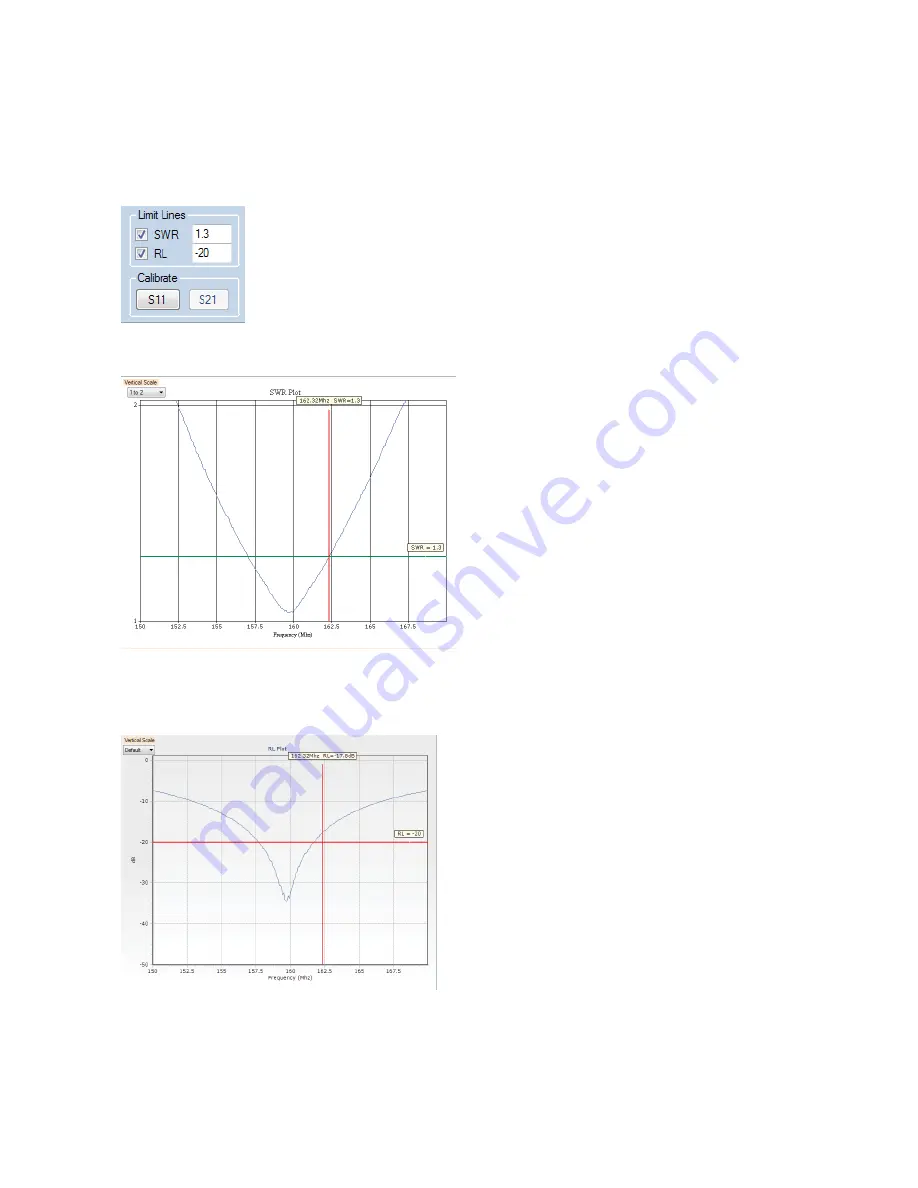
Limit lines can be enabled independently of each other by checking the appropriate box, and entering
the desired test limit as shown here:
Note that limit lines only apply to the SWR and RL charts.
This shows a limit line in use on the SWR chart:
Note that the cursor is at a point on the trace where the value (in this case, the SWR) is at or below
the limit line. Note also that the limit line is GREEN.
If the cursor is at a place where the trace is ABOVE the limit line, the trace turns RED, as shown here
in this Return Loss example:
The cursor is at a point on the curve that is above the -20dB limit, and the limit line (at
-20dB) is RED. Please note that the limit line values can only be changed when the sweeps are NOT
running. Press the STOP button to stop sweeping, change the limits, then press Plot to resume.


