159
Conductivity Operation:
Graphic Function
XL20, 30, 50 and 60 meters
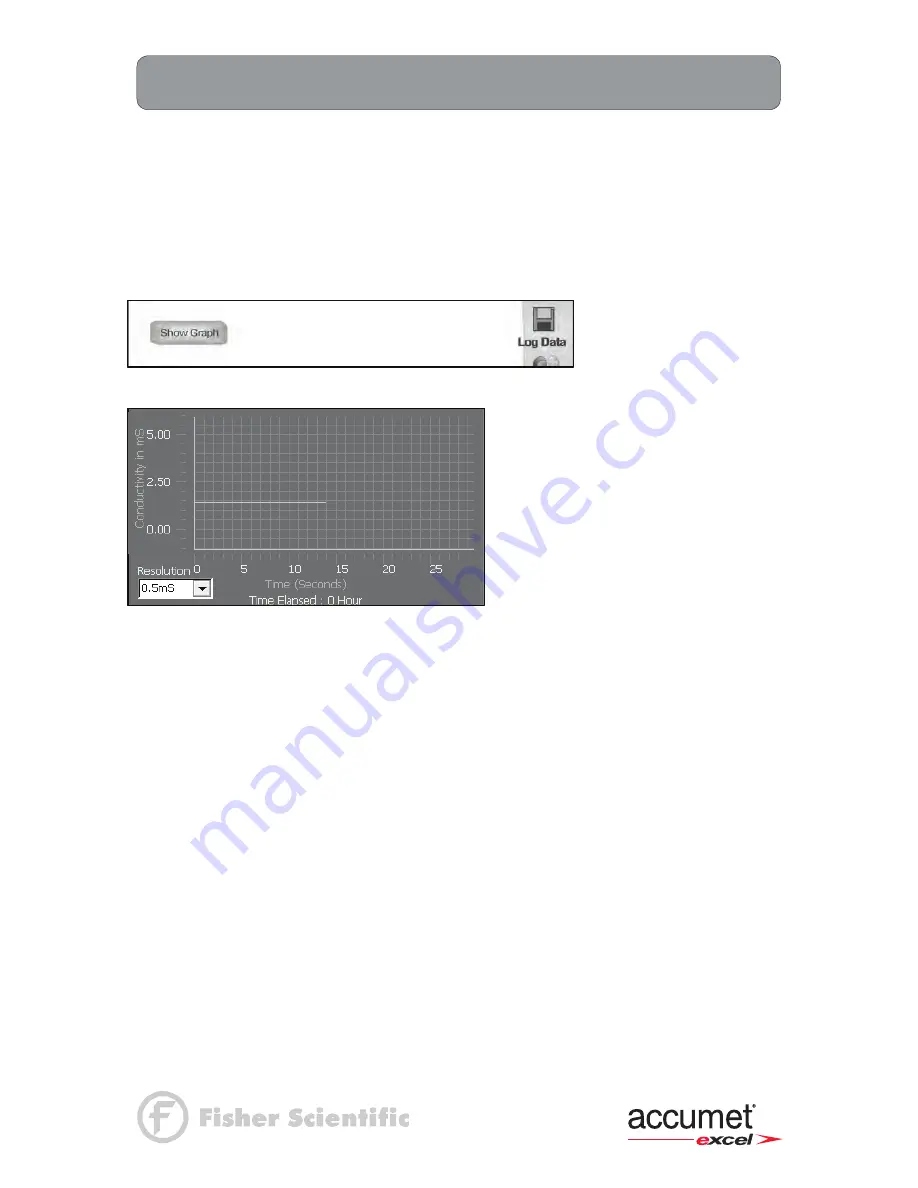
You can view your data as a real-time graph on screen to display conductivity changes over time.
Time is plotted in seconds. The graph refreshes every hour from the start of graphing.
1. To view your data in graph format, touch
Show Graph.
2. To start plotting data, touch
Start Plotting
. To stop plotting data, touch
Stop Plotting.
Once the plotting is stopped, the displayed graph can be dragged left/right and up/down.
3. To view your data more closely, touch.
Zoom In
. To view more data at one time, touch
Zoom Out.
4. To hide the graph, touch
Hide Graph
.
Содержание XL 20
Страница 1: ......
Страница 138: ...127 Ion Operation Known Addition Method XL25 50 and 60 meters...
Страница 140: ...129 Ion Operation Known Subtraction Method XL25 50 and 60 meters...
Страница 142: ...131 Ion Operation Analate Addition Method XL25 50 and 60 meters...
Страница 144: ...133 Ion Operation Analate Subtraction Method XL25 50 and 60 meters...


