


Reviews:
No comments
Related manuals for AQ1210D
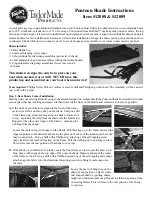
12008
Brand: Taylor Made Pages: 2

1003
Brand: York Fitness Pages: 18

1005
Brand: Safco Pages: 2

4000 Series
Brand: Omni Pages: 193

Mondo
Brand: ACDC Pages: 4

858
Brand: ParaBody Pages: 5

PORTABLE ICE FISHING KIT
Brand: Garmin Pages: 5

Aspect Q-CARD 100-4T
Brand: idi Pages: 38

QNET Physics and Dynamics
Brand: Quanser Pages: 4

RAM T0
Brand: B&G Pages: 16

1005/1041
Brand: Swim & Fun Pages: 17

BreathCare PAP
Brand: Yuwell Pages: 18

BIS U-4A7-082-01C-07-S4
Brand: Balluff Pages: 138

WalkAide II
Brand: XFT Medical Pages: 44

PT2060
Brand: Exo Terra Pages: 11

DuraTech 10'
Brand: Falltech Pages: 30

Z45-D160.02 K1A
Brand: Jäger Pages: 40

ProtoTRAK SLX CNC
Brand: XYZ Machine Tools Pages: 107


